

Annual report project plan powerpoint presentation slides






Try Before you Buy Download Free Sample Product
 Impress Your
 Audience
 100%
100% Editable
 Save Hours
 of Time


Nailing the right annual report project plan PowerPoint presentation is hard. To help you out in revolutionizing your next annual report example slide presentation here we are showcasing a pre built PowerPoint slide deck. Coming to use, then for laying emphasis on your company’s last year activities, achievements, auditor’s report and annual accounts you can utilize this PowerPoint show. Besides this, you can also download this PPT sample file to highlight your company’s grey literature, financial position, income statement, market outlook, future prospects and objectives. Furthermore, PowerPoint presentation slides included in this visual communication helps to brief employees about different components of annual report and their purpose. You can also train employees about how to prepare annual report of a project plan. Exclusive PPT slide designs like vision of the company, company history and milestones, company timeline, world economic outlook, financial highlights, sales highlights etc. turn our pictorial show into a classic readymade deck. In short, we have just the right PPT example to portray your annual project report plan. Simply click to quickly download. Activate your community with our annual report ppt Slides. Get them to indulge in a cleanliness drive.
People who downloaded this PowerPoint presentation also viewed the following :
Content of this Powerpoint Presentation
Slide 1: This slide showcases Annual Report Project Plan. State Your Company Name and get started.
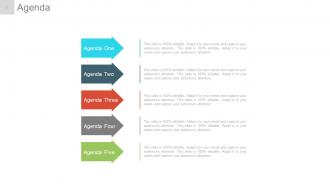
Slide 2: This is an Agenda slide. State your agendas here.
Slide 3: This is an About Us slide. State your position, facts, team/company specifications or anything business here.
Slide 4: This is an About Our Company slide. State your position, facts, team/company specifications or anything business here.
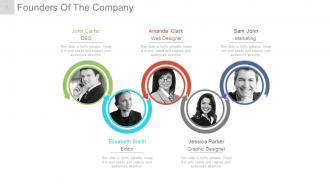
Slide 5: This slide showcases Founders Of The Company to state names, designation and respective image to go with.
Slide 6: This slide presents Our CEO’S Message. State any such message etc. here.
Slide 7: This slide also presents Our CEO’S Message. State any such message etc. here.
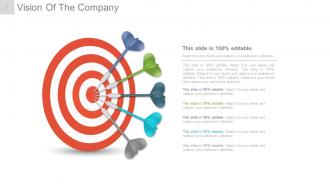
Slide 8: This is Vision of the Company slide. State the Vision of the company here.
Slide 9: This is Vision of the Company slide. State the Vision of the company here.
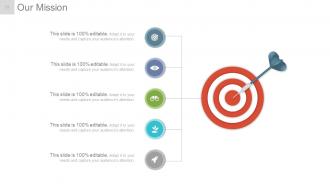
Slide 10: This is Our Mission slide. State the Mision of the company here.
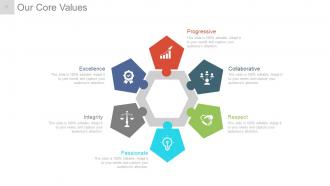
Slide 11: This slide showcases Our Core Values. Some examples given are- Progressive, Collaborative, Respect, Passionate, Integrity, Excellence.
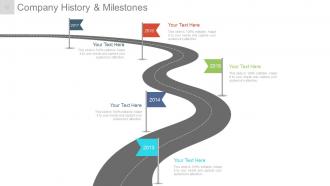
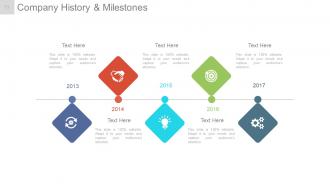
Slide 12: This slide presents Company History & Milestones in roadmap image.
Slide 13: This slide presents Company History & Milestones to be presented with icons and text boxes.
Slide 14: This slide displays Company Timeline to be presented with icons, graphs and text boxes etc.
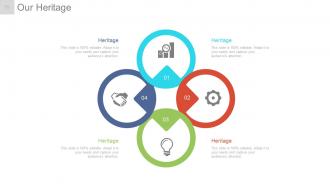
Slide 15: This slide showcases Our Heritage of the company to be shown.
Slide 16: This slide showcases Our Heritage of the company to be shown.
Slide 17: This slide displays the Organization Structure of the company to be presented.
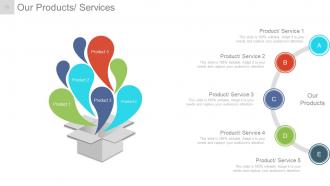
Slide 18: This slide presents Our Products/ Services to state specifications of Product/ Service.
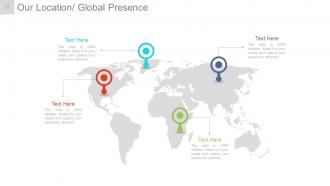
Slide 19: This slide showcases Our Location/ Global Presence on world map image.
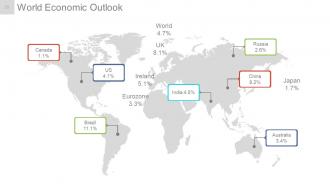
Slide 20: This slide shows World Economic Outlook with a world map image.
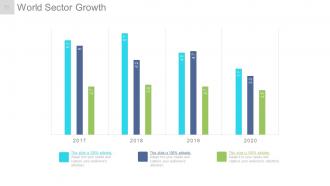
Slide 21: This slide presents World Sector Growth in bar graph form.
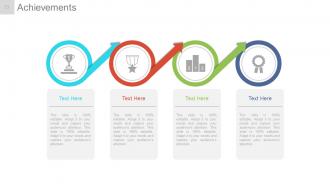
Slide 22: This slide displays Achievements with imagery and text boxes to go with.
Slide 23: This slide displays Achievements with different imagery and text boxes to go with.
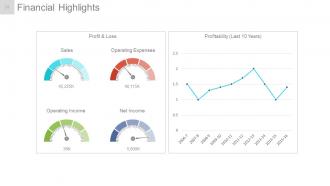
Slide 24: This slide shows Financial Highlights in Line graph form and metric scale for- Profit & Loss, Sales, Operating Expenses, Operating Income, Net Income and Profitability .
Slide 25: This slide presents Financial Highlights. State financial aspects here.
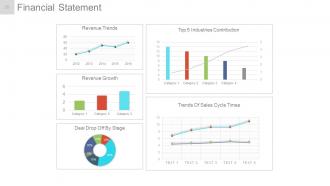
Slide 26: This slide shows a Financial Statement with the following subheadings- Revenue Trends, Revenue Growth, Deal Drop Off By Stage, Trends Of Sales Cycle Times, Top 5 Industries Contribution.
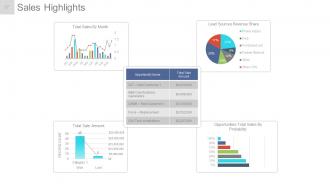
Slide 27: This slide shows Sales Highlights in different graphs form with the following points- Opportunities Total Sales By Probability, Total Sales By Month- Won : Lost Lead Sources Revenue Share.
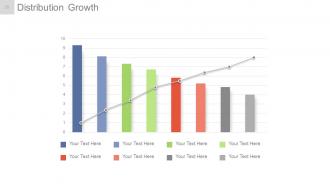
Slide 28: This slide shows Distribution Growth in a creative graph form.
Slide 29: This slide showcases EBITDA Highlights in graph form.
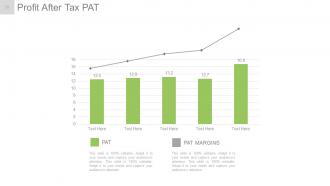
Slide 30: This slide presents Profit After Tax PAT in graph form.
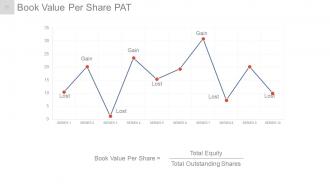
Slide 31: This slide shows Book Value Per Share PAT in line graph form in terms of- Lost and Gain.
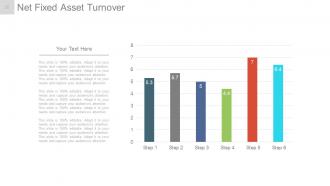
Slide 32: This slide shows Net Fixed Asset Turnover in graph form.
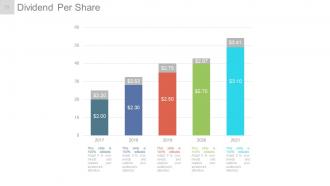
Slide 33: This slide shows Dividend Per Share in bar graph form.
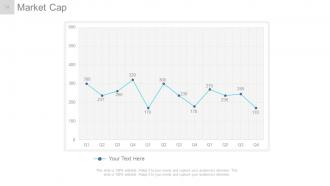
Slide 34: This slide shows Market Cap in graph form.
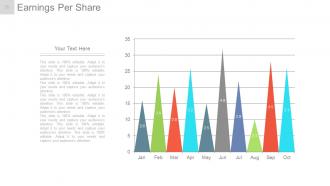
Slide 35: This slide showcases Earnings Per Share in graph form.
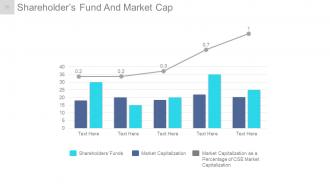
Slide 36: This slide presents Shareholder’s Fund And Market Cap in line graph and bar graph form displaying the following content- Market Capitalization as a Percentage of CSE Market Capitalization, Market Capitalization, Shareholders’ Funds.
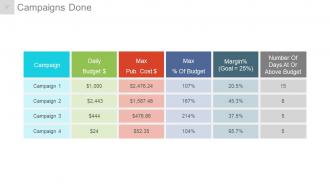
Slide 37: This slide presents a Campaigns Done table.
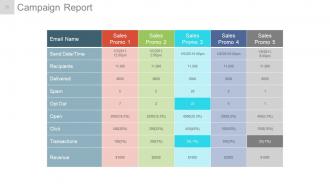
Slide 38: This slide shows Campaign Report in tabular form.
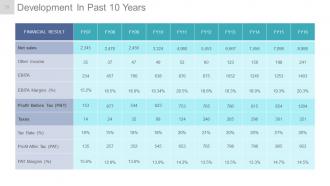
Slide 39: This slide showcases Development In Past 10 Years in tabular form.
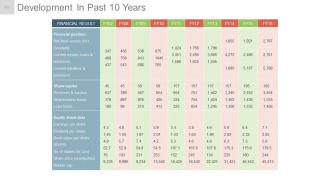
Slide 40: This slide also showcases Development In Past 10 Years in tabular form.
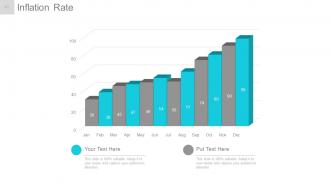
Slide 41: This slide shows Inflation Rate in graph form.
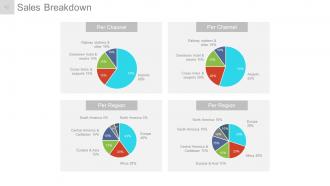
Slide 42: This slide presents Sales Breakdown divided into Per Channel and Per Region.
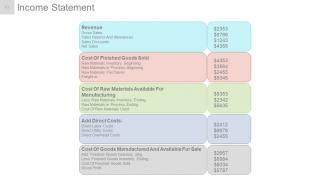
Slide 43: This slide presents Income Statement in tabular form.
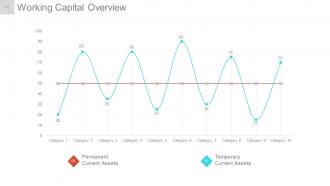
Slide 44: This slide shows Working Capital Overview in scatter graph form with- Temporary Current Assets, Permanent Current Assets as marking points.
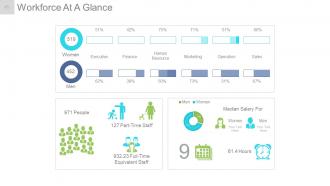
Slide 45: This slide presents Workforce At A Glance containing the following points- Executive, Finance, Human Resource, Marketing, Sales, Operation, Women, Part-Time Staff, Full-Time Equivalent Staff, People, Hours, Median Salary For, Women, Men.
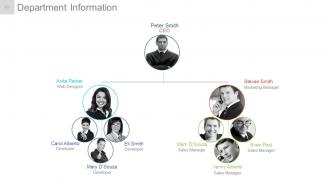
Slide 46: This slide presents Department Information as hierarchy image with names.
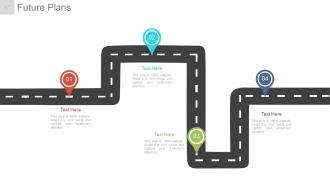
Slide 47: This slide presents Future Plans to be shown on a roadmap.
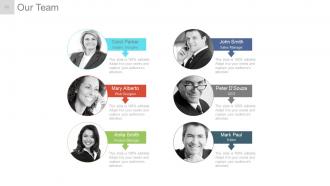
Slide 48: This slide showcases Our Team specifications with name, designation and image boxes.
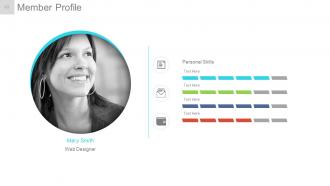
Slide 49: This slide presents a Member Profile with name, skills etc.
Slide 50: This slide is titled Additional Slides to proceed forward. You can change the slide content as per need.
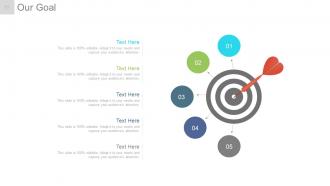
Slide 51: This is an Our Goal slide. State goals etc. here.
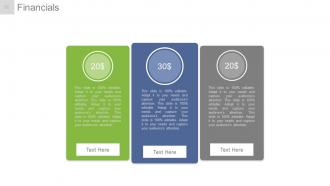
Slide 52: This is Financials Score table slide. State financial aspects here.
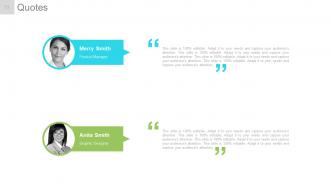
Slide 53: This is a Quotes slide to convey company messages, beliefs etc. You can change the slide content as per need.
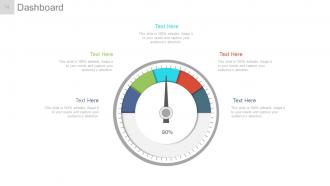
Slide 54: This is a Dashboard slide to show kpis, metrics etc.
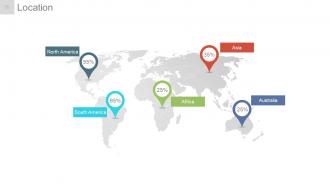
Slide 55: This is a Location slide of world map image to show global presence, growth etc.
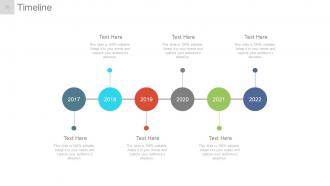
Slide 56: This is a Timeline slide to present growth, journey, milestones etc.
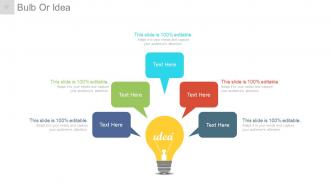
Slide 57: This is a Bulb Or Idea slide to show innovative aspects, ideas, information etc.
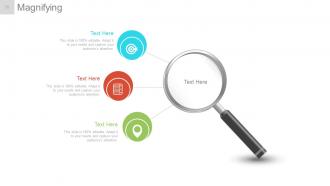
Slide 58: This slide shows a Magnifying glass image with text boxes. State information etc. here.
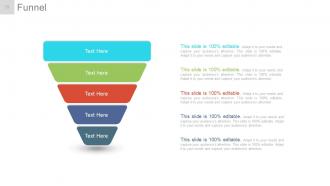
Slide 59: This slide displays a Funnel image. State information, funneling aspects etc. here.
Slide 60: This is a Thank You slide with Address# street number, city, state, Contact Numbers, Email Address.
Annual report project plan powerpoint presentation slides with all 60 slides:
Heighten the caliber of the interaction with our Annual Report Project Plan Powerpoint Presentation Slides. Enhance the degree of intelligence displayed.




FAQs for Annual report project plan
Okay so first things first - get your timeline mapped out with realistic deadlines, then add extra buffer time because these things *always* run over. Figure out your content sections and key messaging early. You'll need design specs and brand guidelines locked down too. The approval chain is honestly where most projects die, so sketch out who signs off when. Budget breakdown is obvious but don't forget distribution costs if you're doing print. Oh and definitely start with a kickoff meeting - sounds corporate but it actually saves headaches later when everyone's aligned on what you're actually building.
Honestly, start way earlier than you think - like 6-8 weeks out. Figure out who actually owns the data you need first: finance folks, HR, operations, marketing. Send them super specific requests instead of those generic "send me your highlights" emails (learned this the hard way). Quick interviews with department heads are gold for getting the real stories behind numbers. Oh, and don't forget customer feedback and employee survey stuff - that always makes reports way more interesting. Third-party awards too if you got any. Pro tip: set up a shared doc where teams can drop their wins all year long. Future you will thank present you.
Your stakeholders will make or break this project, so don't even think about skipping their input. Get to executives, investors, and department heads early - they'll tell you which stories matter and what data to spotlight. I learned this the hard way on my first report when leadership completely redirected everything halfway through. Their feedback drives your content choices, how you spend resources, and review timelines. Build in regular check-ins too. Trust me, you'll save yourself so many headaches if everyone's aligned from day one instead of scrambling later.
Templates are total game-changers for annual reports! They keep your financial data looking clean and consistent, which honestly saves your sanity when you're juggling a million spreadsheets. Your charts and graphs all match, colors stay on-brand, and readers can actually follow the flow without getting confused. I'd definitely pick something that matches your company colors first - oh, and test it on a few sample pages before committing. Trust me on that one. The whole point is making your stakeholders focus on the numbers that matter instead of wonky formatting. Way less stress overall.
Start with your biggest wins right at the top - nobody has time to hunt for the good stuff. I'd structure it like telling a story: summary, major wins, problems you solved, what's next. Most people bail after page 3 anyway, so put the impressive metrics upfront. Break everything up with visuals and subheadings. Keep your financial stuff clean but don't overwhelm them with spreadsheets (throw detailed tables in the back). Oh, and end each section with actual next steps so people know where you're headed.
Look, design isn't just pretty pictures - it actually shapes whether people believe your content or bounce immediately. White space makes dense info breathable. Consistent fonts and colors build trust (weird how much that matters, right?). Most folks will skip text walls anyway, so charts and visuals tell your story better. Typography choice is sneaky important too. Serif fonts feel traditional and credible, sans-serif comes across modern. Here's the thing though - don't just make it look nice. Figure out your main points first, then design everything around those key messages. That's where the magic happens.
Ugh, content review cycles are the absolute worst - they drag on forever, I swear. Don't set deadlines without checking with design and finance first because they're already drowning during annual report season. Build in extra time for executive changes (trust me, there will be some). Get your data sources figured out early or you'll be panicking later trying to find numbers. Oh, and start reaching out to stakeholders now. Make sure you get those review timelines in writing too - people conveniently "forget" what they agreed to otherwise.
Honestly, tech can cut your timeline in half if you do it right. SharePoint or Google Workspace lets everyone work on different sections at once—way better than emailing files around like animals. InDesign with cloud sync speeds up design iterations, and those automated data viz tools pull straight from your systems. No more updating charts manually (thank god). Digital distribution is clutch too since you can track who's actually reading and tweak things in real time. I'd start by figuring out what manual stuff takes forever, then hit those pain points first with the right tools.
Check your download numbers and how long people actually spend reading it. Analytics will show which parts grab attention most. Social shares help too, though let's be real - annual reports aren't exactly TikTok material. The stuff that actually matters though? Whether you're getting more investor calls or better stakeholder feedback. Does it help with fundraising goals? Survey your key people afterward - did it change how they see your org? That intel is gold for next year. Oh, and track any media pickup you get from it.
Before you even start writing, map everything back to your big strategic goals. Each section needs to connect - your financials, ops updates, all of it. Honestly, most annual reports I've read are just boring recaps with zero "why" behind the numbers. Your story should show how this year actually got you closer to where you're heading. Don't forget to end with next year's roadmap so it all flows together. Oh, and maybe throw in something about lessons learned? People eat that stuff up.
Dude, ditch those boring spreadsheets! Heat maps are amazing for showing performance stuff, and timeline graphics make growth trends way easier to follow. Icons help too - way better than walls of numbers. Dashboards are solid, though I'm personally obsessed with before/after comparisons right now. They just make everything click for people. The whole point is getting your data to actually tell a story instead of putting everyone to sleep. Start with your top 3 metrics and build cool visuals around those. Trust me, anything's better than those nightmare Excel dumps we used to torture people with.
Honestly, just wrap your data around actual stories from real people - customers, employees, whoever. Like instead of "revenue up 15%" tell them how that growth let you save some client's ass when they were in crisis mode. Sounds corny but trust me, stories stick way better than boring bullet points ever will. Pick maybe 2-3 solid wins from this year and build little narratives around them. Add some quotes with actual emotion, not corporate speak. Your section headers should flow like you're telling a story too. The whole point? Make people feel something when they read your numbers, not just nod and move on.
Definitely go with charts and infographics - they're lifesavers for annual reports. Bar charts work great for revenue stuff, pie charts for market breakdowns, and trend lines show growth really well. People just zone out when there's too much text, so visuals are everything. Oh, and if you're covering operational changes, throw in some process flowcharts too. I learned this the hard way last year. Keep your colors consistent with your brand and make sure people in the back can actually read it. Test everything beforehand - trust me on this one!
Check your project plan monthly when you're actually working on it, quarterly otherwise. Trust me, stuff always takes longer than you think - stakeholders disappear, design revisions pile up, content gets stuck somewhere. Monthly 15-minute reviews save you from panicking later when deadlines loom. Do deeper quarterly check-ins where you can shift resources or cut scope if needed. Oh, and set those calendar reminders right now while you're thinking about it. Once things get crazy, you'll totally forget to do these reviews, then wonder why everything's falling apart at the last minute.
Okay so first thing - if you're publicly traded, SEC filing requirements are non-negotiable. Your financial data needs to be audited and certified (yeah, it's a pain but no way around it). Executive compensation disclosures, risk factors, material changes - all that stuff has to be covered too. Industry-specific regulations might apply depending on your business. Oh, and don't overlook the digital accessibility stuff for your online version. International operations? You might need translations. Honestly, I'd make a compliance checklist right away and get legal to look it over before you dive in. Way better than panicking at the deadline.
-
Great experience, I would definitely use your services further.
-
Visually stunning presentation, love the content.