


Annual report production timeline powerpoint presentation slides


Try Before you Buy Download Free Sample Product
 Impress Your
 Audience
Editable
of Time


Showcasing the right annual report presentation is hard. That is why our team of experts have come up with content-ready 60 slides Annual Report Production Timeline Powerpoint Presentation Slides to help you with your next annual report presentation. This annual report production schedule template PPT sample file has slides like company’s history and milestones, company timeline, our heritage, organization structure, our product and services, company’s global presence, world economic outlook, world sector growth, achievements, financial highlights and statement, distribution growth, EBITDA highlights, net fixed asset turnover, market cap, campaigns done, development chart, inflation rate and many more. Besides this, you can also download this annual report project timeline presentation sample file to highlight your company’s grey literature, financial position, income statement, market outlook, prospects and objectives. Furthermore, PowerPoint presentation slides included in our visual PPT template deck helps to brief employees about different components of annual report and their purpose. You can also train employees about how to prepare annual report of a project plan. Exclusive annual report ppt slide designs like vision of the company, company history and milestones, company timeline, world economic outlook, financial highlights, sales highlights etc. makes this deck versatile. Simply download Annual Report Production Timeline Powerpoint Presentation Slides and present your PPT like no one has ever done.. Channel your thoughts along our Annual Report Production Timeline Powerpoint Presentation Slides. See them flow ceaselessly on.
People who downloaded this PowerPoint presentation also viewed the following :
Content of this Powerpoint Presentation
Slide 1: This slide introduces Annual Report with an image to go with. State Your Company Name and get started.
Slide 2: This slide is titled Additional Slides to proceed forward.
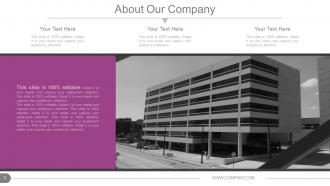
Slide 3: This slide presents About Our Company. State company aspects, specifications here.
Slide 4: This slide also presents About Our Company. State company aspects, specifications here.
Slide 5: This slide showcases Founders Of The Company to state names, designation and respective image to go with.
Slide 6: This slide presents Our CEO’S Message. State any such message etc. here.
Slide 7: This slide also presents Our CEO’S Message. State any such message etc. here.
Slide 8: This is Our Vision slide. State the Vision of the company here.
Slide 9: This is also Our Vision slide with target imagery. State the Vision of the company here.
Slide 10: This is Our Mission slide. State the Mision of the company here.
Slide 11: This slide shows Our Core Values. Some examples given are- Progressive, Collaborative, Respect, Passionate, Integrity, Excellence.
Slide 12: This slide presents Company History & Milestones in roadmap image.
Slide 13: This slide presents Company History & Milestones to be presented with icons and text boxes.
Slide 14: This slide presents Company Timeline to be presented with icons, graphs and text boxes etc.
Slide 15: This slide showcases Our Heritage of the company to be shown.
Slide 16: This slide showcases Our Heritage of the company to be shown.
Slide 17: This slide displays the Organization Structure of the company to be presented.
Slide 18: This slide presents Our Products/ Services to state specifications of Product/ Service.
Slide 19: This slide shows Our Location/ Global Presence on world map image.
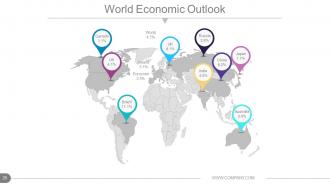
Slide 20: This slide shows World Economic Outlook with a world map image.
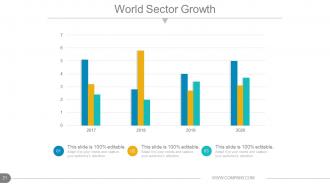
Slide 21: This slide presents World Sector Growth in bar graph form.
Slide 22: This slide displays Achievements with imagery and text boxes to go with.
Slide 23: This slide displays Achievements with different imagery and text boxes to go with.
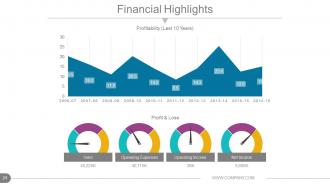
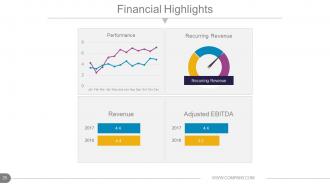
Slide 24: This slide shows Financial Highlights in Line graph form and metric scale for- Profit & Loss, Sales, Operating Expenses, Operating Income, Net Income and Profitability .
Slide 25: This slide showcases Financial Highlights. State financial aspects here.
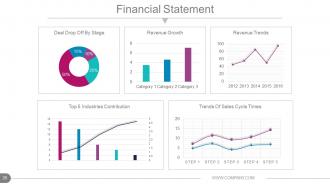
Slide 26: This slide shows a Financial Statement with the following subheadings- Revenue Trends, Revenue Growth, Deal Drop Off By Stage, Trends Of Sales Cycle Times, Top 5 Industries Contribution.
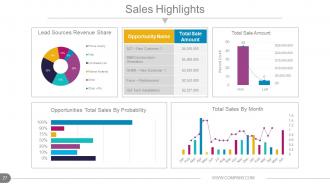
Slide 27: This slide shows Sales Highlights in different graphs form with the following points- Opportunities Total Sales By Probability, Total Sales By Month- Won : Lost Lead Sources Revenue Share.
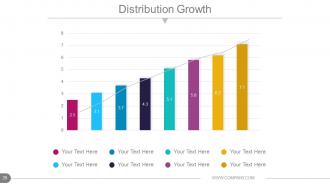
Slide 28: This slide shows Distribution Growth in graph form.
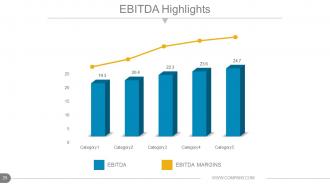
Slide 29: This slide showcases EBITDA Highlights in graph form.
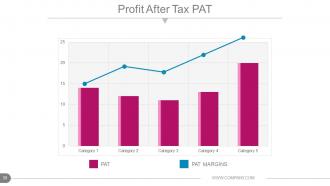
Slide 30: This slide presents Profit After Tax PAT in graph form.
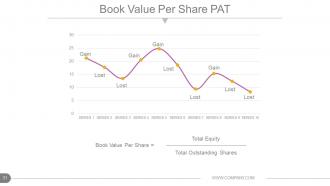
Slide 31: This slide shows Book Value Per Share PAT in line graph form in terms of- Lost Gain
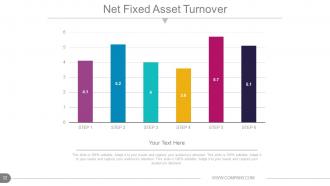
Slide 32: This slide shows Net Fixed Asset Turnover in graph form.
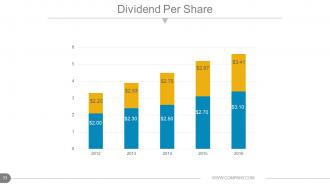
Slide 33: This slide shows Dividend Per Share in bar graph form.
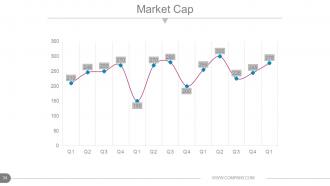
Slide 34: This slide shows Market Cap in line chart form.
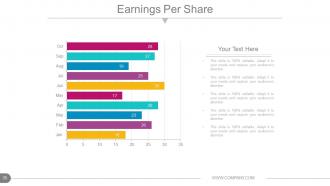
Slide 35: This slide showcases Earnings Per Share in graph form.
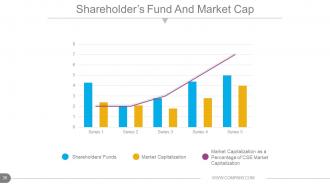
Slide 36: This slide presents Shareholder’s Fund And Market Cap in line graph and bar graph form displaying the following content- Market Capitalization as a Percentage of CSE Market Capitalization, Market Capitalization, Shareholders’ Funds.
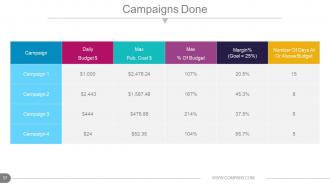
Slide 37: This slide shows a Campaigns Done table.
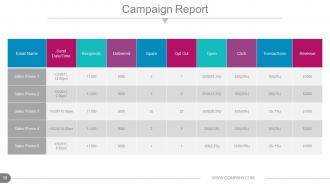
Slide 38: This slide shows Campaign Report in tabular form.
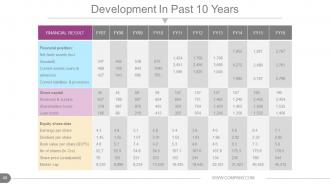
Slide 39: This slide showcases Development In Past 10 Years in tabular form.
Slide 40: This slide also showcases Development In Past 10 Years in tabular form.
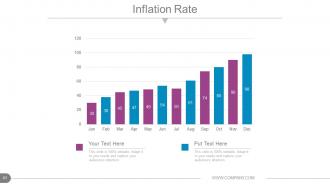
Slide 41: This slide shows Inflation Rate in graph form.
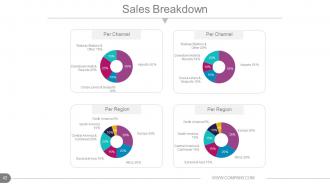
Slide 42: This slide presents Sales Breakdown divided into Per Channel and Per Region.
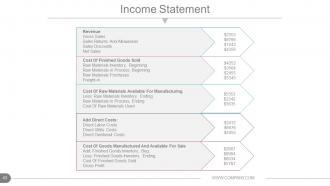
Slide 43: This slide presents Income Statement table.
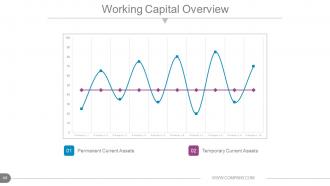
Slide 44: This slide shows Working Capital Overview in scatter graph form with- Temporary Current Assets Permanent Current Assets as marking points.
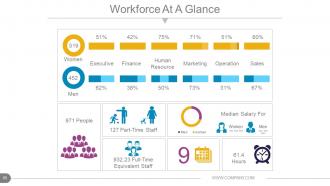
Slide 45: This slide presents Workforce At A Glance containing the following points- Executive, Finance, Human Resource, Marketing, Sales, Operation, Women, Part-Time Staff, Full-Time Equivalent Staff, People, Hours, Median Salary For, Women, Men.
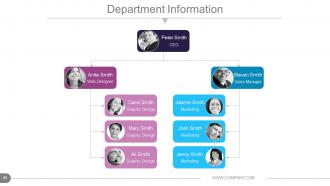
Slide 46: This slide presents Department Information as hierarchy image with names.
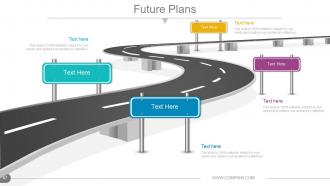
Slide 47: This slide presents Future Plans to be shown on a roadmap.
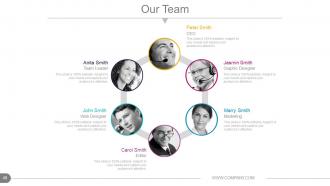
Slide 48: This slide showcases Our Team specifications with name, designation and image boxes.
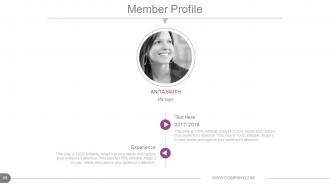
Slide 49: This slide presents a Member Profile with name, skills etc.
Slide 50: This slide is titled Additional slides for moving forward. You can change/ alter the content as per need.
Slide 51: This is an Our Goal slide. State goals etc. here.
Slide 52: This is a Financial Score table slide. State financial aspects here.
Slide 53: This is a Quotes slide to convey company messages, beliefs etc.
Slide 54: This is a Dashboard slide to show kpis, metrics etc.
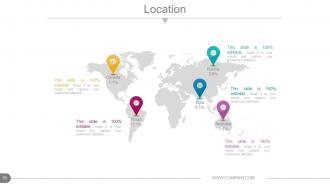
Slide 55: This is a Location slide of world map image to show global presence, growth etc.
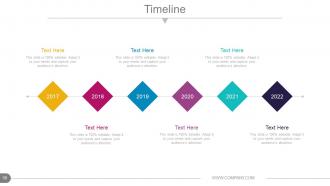
Slide 56: This slide presents a Timeline. Jot down your highlights, or present milestones etc. here.
Slide 57: This is a bulb or Idea image slide to show information, innovative aspects etc.
Slide 58: This is a Magnifying glass image slide to show information, scoping aspects etc.
Slide 59: This slide showcases Funnel displaying LEADS.
Slide 60: This is a Thank You slide with Address# street number, city, state, Contact Numbers, Email Address.
Annual report production timeline powerpoint presentation slides with all 60 slides:
Acquire clientele with our Annual Report Production Timeline Powerpoint Presentation Slides. Your thoughts become a big attraction.


FAQs for Annual report production timeline
Dude, start like 4-6 months out minimum. Trust me on this. First you'll need to collect all your data (takes forever), then write everything, get it designed, and brace yourself for the review nightmare. Stakeholders will want changes. Legal will want changes. Everyone wants changes, honestly. Build buffer time between each step because it always takes longer than you think. Oh, and assign section owners early or you'll have chaos. The review process is brutal - plan for at least 2-3 rounds of edits from different departments.
Honestly, I'd work backwards from your year-end date first. Figure out your big deadlines - audit wrap-up, board approval, publishing. Then map how long each usually takes you guys. Most teams I know totally underestimate review cycles and end up in panic mode later. Buffer time is your friend here, especially with external stuff like when your auditors are free or board meetings. Aim for 60-90 days post year-end if possible. Oh, and double-check any regulatory deadlines that might squeeze your timeline tighter.
So for your annual report timeline, I'd probably start with Microsoft Project if your company already has it - that thing's a beast for complex scheduling. Asana and Monday.com are way friendlier though, especially when you're coordinating with a bunch of people. Actually, don't sleep on Excel either. I know it sounds basic but I've seen teams crush it with a well-organized spreadsheet. Map out your big milestones first, then work backwards. Whatever you pick, just make sure everyone will actually use it - doesn't matter how fancy it is if half your team ignores it.
Timelines are honestly game-changers because they show people exactly when stuff happened and what's coming up. No more guessing games. Think of it like those project schedules we use at work, but for anyone outside the company who wants to track your progress. When you put actual dates on product launches, financial results, big decisions - whatever - people can see patterns and catch delays way easier. It builds trust too, which is huge. Your stakeholders get a clear picture of where you've been and where you're headed, instead of dealing with those annoying vague updates that tell you basically nothing.
Oh man, stakeholder feedback will absolutely wreck your timeline if you don't get ahead of it. Build in specific review windows upfront - like, actual deadlines for each group. Board members, investors, whoever. Don't leave it open-ended because literally everyone turns into an editor once they see the draft (it's honestly wild how many opinions come out of nowhere). Set those deadlines early in your planning. Otherwise you're stuck with conflicting suggestions rolling in right before filing. Trust me on this one - make a structured schedule and actually stick to it, even when people push back.
Oh man, definitely don't underestimate timing - that's the killer. Data collection sounds like it'll take two days but then people are slow getting back to you and nothing adds up right, so suddenly it's two weeks. December planning is absolute chaos too (learned that one the hard way). Executives will want changes at the last second, guaranteed. Plus you've got holidays and people taking time off right when you need them most. Honestly? Map everything out like 4-5 months early and build in extra time for reviews. Trust me on this.
Look, nobody's gonna read through pages of numbers - your brain just glazes over. Charts and graphs actually let people spot trends fast. I'd use color coding for your big milestones, maybe throw in some progress bars so readers can see completion rates instantly. Icons help too, they guide people through all that complex stuff without getting lost. Here's the thing though - don't just slap visuals everywhere for decoration. Pick your most important metrics first, then find charts that actually make those insights jump out. Otherwise you're just making pretty nonsense.
Ok so first thing - map out your data sources like 3-4 months early. I learned this the hard way lol. There's ALWAYS that one team that takes ages to get back to you. Calendar invites work way better than emails btw, include actual due dates. Build in buffer time because people will need revisions (they always do). I use a basic spreadsheet to track who's sent what - nothing fancy. Weekly check-ins starting 8 weeks out are clutch. Don't feel bad about being that person who follows up constantly. Better to be annoying than scrambling last minute. If someone's being slow, escalate early rather than hoping they'll come through.
Honestly, it's all over the place depending on your industry. Tech companies usually finish fast since everything's digital. Manufacturing and retail? Way longer because of inventory nightmares and supply chain stuff. Financial services are weirdly efficient at this - they've got it down pat because the SEC doesn't mess around with deadlines. Healthcare and energy take forever though, all that compliance paperwork is brutal. My advice? Look at what your competitors do timeline-wise and then add extra buffer time your first go-around. Trust me, weird delays always pop up that you never saw coming.
Honestly, milestone completion rates are your best friend here. Track how many days you're ahead or behind on each phase, plus stakeholder response times - people are slower than they promise, trust me. The big one that always bites me? Draft review cycles take way longer than anyone estimates. Keep an eye on data collection deadlines and any regulatory stuff you absolutely can't miss. Weekly check-ins help you catch problems before they explode. Oh, and build in buffer time based on what you're actually seeing, not what sounds reasonable on paper. Resource allocation matters too, but the timeline stuff is usually what kills projects.
Honestly, tech can shave weeks off your annual report - it's pretty wild. Start with automated data collection tools that pull financials straight from your systems. No more manual gathering nonsense. Cloud platforms let everyone work on different sections at once, which is a game changer. AI writing tools help with the boring boilerplate stuff and spot inconsistencies you'd miss. Design templates mean you're not reinventing the wheel every year (thank god). Figure out what's eating most of your time first, then find tools to fix those specific headaches.
Okay so definitely map out your data collection deadline, first draft, stakeholder reviews, and final approval. Buffer time is CRUCIAL - like when the CEO inevitably wants their whole section redone at the last minute (happens every time, I swear). Don't forget design and production deadlines if you're printing. The thing most people mess up? Not enough time between review rounds. Give yourself a solid week between each cycle. Oh, and always work backwards from your pub date - makes setting realistic deadlines way easier. Trust me on the buffer thing though, you'll thank me later.
Look, mapping out your timeline early means you can actually tell a coherent story instead of frantically piecing together random info at the last second. Trust me on this - nobody wants to be hunting for crucial data at 2am (ugh, the worst). You'll have time to spot where your narrative has holes and fix the flow between sections. Start planning 4-6 months ahead, maybe even earlier if you're feeling ambitious. That way you can sequence your wins, challenges, and future plans in a way that builds momentum. Your stakeholders will actually want to keep reading instead of just skimming for the numbers.
You absolutely need to get everyone on the same page from day one. Finance has audit deadlines, marketing wants weeks to review content, legal needs compliance time - the works. I learned this the hard way when a March deadline turned into a complete May mess because nobody talked upfront. Each department's swamped at different times too, so you've got to figure out when people are actually available. Honestly, just get all the department heads in one room early on. Map out who needs what and when, then build in extra buffer time because something always goes sideways.
Honestly, just build in way more buffer time than you think you need. Financial validation and executive sign-offs are always the worst bottlenecks - pad those sections with extra weeks. Set your "final" deadline like 2-3 weeks before you actually need it done. When our auditors screwed us over last year with last-minute issues, I wished I'd done this! Track delay triggers from day one and have escalation plans ready. Oh, and break up sections so different people can work simultaneously - don't let everything pile up on one person at the end.
-
Really like the color and design of the presentation.
-
Colors used are bright and distinctive.