Automation Flow Chart With Collaborative Manufacturing Process
Try Before you Buy Download Free Sample Product
Audience
Editable
of Time
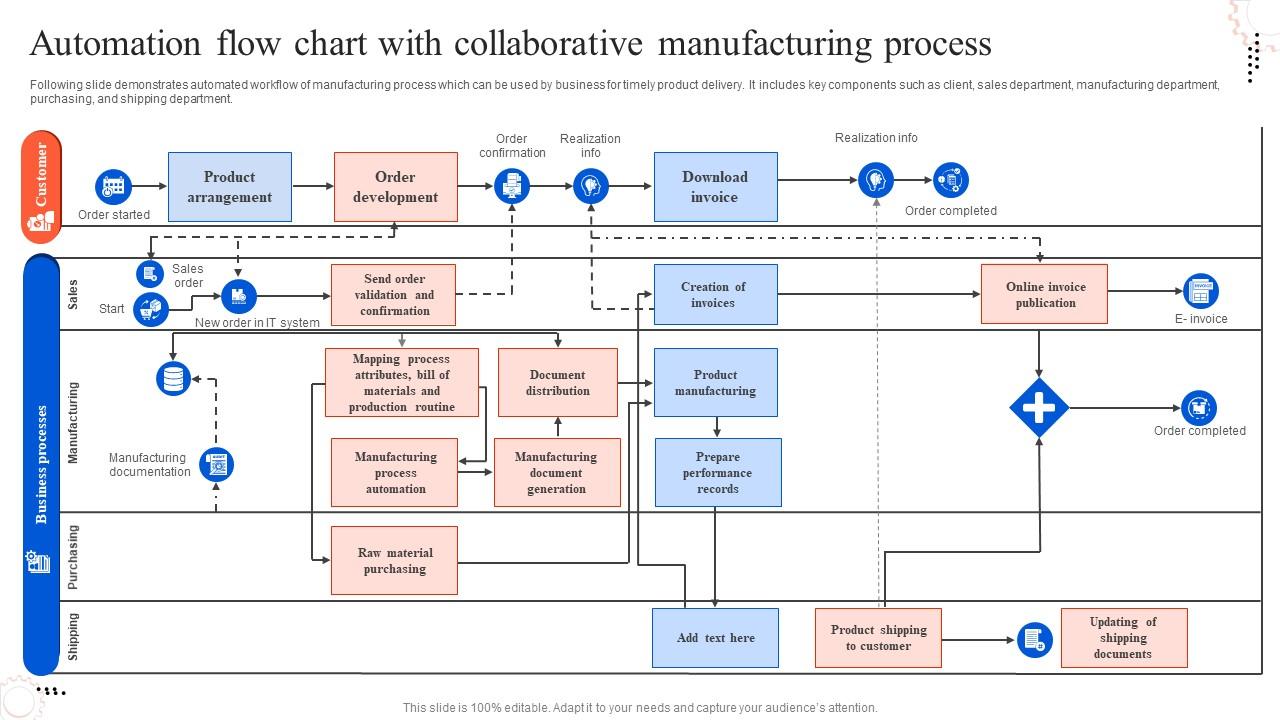
Following slide demonstrates automated workflow of manufacturing process which can be used by business for timely product delivery. It includes key components such as client, sales department, manufacturing department, purchasing, and shipping department.
People who downloaded this PowerPoint presentation also viewed the following :
Automation Flow Chart With Collaborative Manufacturing Process with all 6 slides:
Use our Automation Flow Chart With Collaborative Manufacturing Process to effectively help you save your valuable time. They are readymade to fit into any presentation structure.
FAQs for Automation Flow Chart With
Key components of an effective automation flow chart include clear start/end points, decision nodes, process steps, data inputs/outputs, and error handling pathways. These elements work together by mapping complex workflows, identifying bottlenecks, and streamlining operations, with many organizations finding that well-designed charts reduce implementation time and enhance operational efficiency.
Automation flow charts improve operational efficiency by visualizing process bottlenecks, identifying redundant tasks, and mapping optimal workflows across departments. Through clear visual documentation, organizations streamline resource allocation, reduce manual errors, and accelerate decision-making processes, with many manufacturing and financial services companies finding that standardized automation workflows ultimately deliver faster cycle times and enhanced productivity.
Popular software tools for creating automation flow charts include Microsoft Visio, Lucidchart, Draw.io, Creately, and SmartDraw, each offering specialized templates and automation-specific symbols. These platforms streamline workflow visualization by providing drag-and-drop functionality, real-time collaboration features, and integration capabilities with business systems, ultimately enabling organizations to map complex processes more efficiently and communicate automation strategies across teams.
Automation flow charts facilitate better communication by providing visual clarity, standardizing processes, eliminating ambiguities, and creating shared understanding across departments. These visual tools enable teams to identify bottlenecks, coordinate handoffs, and align on responsibilities more effectively, with many organizations finding that clear process visualization reduces miscommunication and accelerates project implementation.
Common mistakes include overcomplicating processes, skipping error handling protocols, neglecting user feedback loops, ignoring scalability requirements, and failing to define clear decision points. These oversights can lead to inefficient workflows, system breakdowns, and poor user experiences, with many organizations finding that thorough planning and iterative testing ultimately deliver more robust automation solutions.
Identifying automation candidates through flow charts involves mapping current workflows, analyzing task complexity, frequency, and resource requirements, then highlighting repetitive, rule-based, and time-intensive processes. These visual assessments enable organizations to prioritize high-volume tasks like data entry, invoice processing, and customer onboarding, while evaluating ROI potential, ultimately delivering strategic resource allocation and competitive operational efficiency.
Decision points serve as conditional gates in automation flow charts, determining which path the process follows based on specific criteria, data validation, or user inputs. These critical junctions enable systems to handle multiple scenarios automatically, such as banks routing loan applications based on credit scores or hospitals triaging patient data, ultimately delivering personalized outcomes and streamlined operations.
Standardized symbols in automation flow charts deliver universal comprehension, reduced training time, improved collaboration across teams, enhanced troubleshooting efficiency, and seamless integration with existing systems. These symbols streamline communication by eliminating ambiguity, accelerating project timelines, and enabling cross-functional teams to quickly interpret processes, with many organizations finding that standardization ultimately reduces errors and operational costs significantly.
Automation flow charts enable troubleshooting by visually mapping each workflow step, identifying bottlenecks, redundancies, and failure points that impact efficiency. Through systematic analysis, organizations can streamline processes, eliminate unnecessary steps, and automate manual tasks, with many companies finding that optimized workflows reduce operational costs by 30-40% while significantly improving service delivery times.
Flow charts show sequential steps and decision points in automation processes, while swimlane diagrams organize these same processes by responsibility, with vertical or horizontal lanes representing different departments, roles, or systems. Swimlane diagrams enhance accountability and clarity in complex automation workflows, with many organizations finding that this approach streamlines cross-functional processes, reduces handoff confusion, and ultimately delivers better operational transparency.
Measuring automation flow chart effectiveness involves tracking key performance indicators like processing time reduction, error rates, resource utilization, and cost savings compared to manual processes. Organizations typically monitor throughput metrics, compliance adherence, and user adoption rates, with many finding that successful automation delivers 30-50% efficiency gains while improving accuracy and customer satisfaction.
Automation flow charts enhance project management by visualizing workflows, identifying bottlenecks, standardizing processes, and enabling resource optimization across teams. These visual tools streamline task sequencing, automate routine approvals, and improve timeline accuracy, with many organizations finding that structured workflow mapping reduces project delays by 30-40% while enhancing team coordination and deliverable quality.
Successful automation flow charts include customer onboarding processes in banks, inventory management systems in retail, patient admission workflows in hospitals, and quality control procedures in manufacturing. These implementations streamline operations by reducing manual touchpoints, minimizing errors, and accelerating processing times, with many organizations finding that well-designed automation flows deliver cost reductions and enhanced customer experiences.
Ensure your automation flow chart stays relevant by establishing regular review cycles, incorporating feedback mechanisms from end-users, and building flexible decision points that accommodate process variations. Successful organizations implement quarterly assessments, maintain version control systems, and create modular workflows that can be easily updated, ultimately delivering sustained operational efficiency and adaptability in an increasingly dynamic business environment.
When presenting automation flow charts to stakeholders, best practices include using clear visual hierarchies, standardized symbols, logical step sequences, and highlighting key decision points and outcomes. These presentations should emphasize business benefits like cost savings and efficiency gains, provide real-world implementation timelines, and address potential concerns upfront, with many organizations finding that interactive walkthroughs enhance stakeholder understanding and buy-in.
-
Perfect template with attractive color combination.
-
I looked at their huge selection of themes and designs. They appeared to be ideal for my profession. I'm sure I'll grab a few of them.