


Material Process Flowchart For Manufacturing Company




Try Before you Buy Download Free Sample Product
 Impress Your
 Audience
 100%
100% Editable
 Save Hours
 of Time


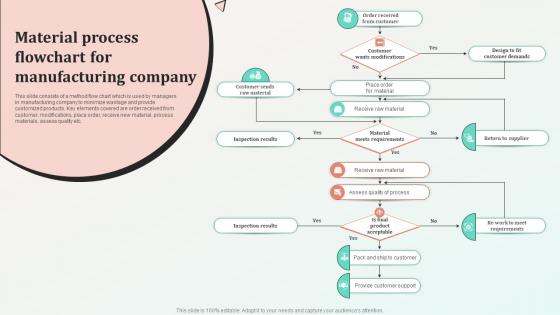
This slide consists of a method flow chart which is used by managers in manufacturing company to minimize wastage and provide customized products. Key elements covered are order received from customer, modifications, place order, receive new material, process materials, assess quality etc.
People who downloaded this PowerPoint presentation also viewed the following :
Material Process Flowchart For Manufacturing Company with all 6 slides:
Use our Material Process Flowchart For Manufacturing Company to effectively help you save your valuable time. They are readymade to fit into any presentation structure.






FAQs for Material Process Flowchart
You'll want rectangles for process steps, diamonds for decisions, and ovals for start/end points. Flow arrows connect everything together. Don't forget inputs and outputs - what goes in and comes out at each stage. Storage points matter too since stuff usually sits somewhere between processes. Oh, and add inspection points if you do quality checks. Honestly, the main thing is keeping it simple enough that anyone can track materials from start to finish. I'd map what you're doing now first, then worry about making it better later. Way easier than trying to design the perfect process right off the bat.
Dude, those flowcharts are game-changers for seeing where stuff gets stuck. Map out your current process first - all the messy reality, not what you think happens. Then you'll spot where materials just sit around waiting or where you're doing unnecessary steps. My old boss used to say it's like detective work, which sounds cheesy but honestly makes sense. The visual part is huge because your team can actually see the problems instead of just hearing about them. They'll start pointing out weird inefficiencies you never noticed. Focus on the biggest bottlenecks first, then work backwards from there.
For flowcharts, I'd go with Draw.io first since it's totally free and works way better than you'd expect. Visio's the old-school standard but costs a fortune - only worth it if work's paying. Lucidchart is solid for team stuff since everyone can edit online at once. PowerPoint actually works decent for quick drafts too, though that probably sounds weird. Start with Draw.io and see how it goes. You can always upgrade to Lucidchart later if you need fancier collaboration features or whatever.
Hey! So your start point is basically where raw materials first come into the process. End point? That's where your finished product heads out the door. Use ovals or rounded rectangles to mark these - circles work fine too, whatever looks good to you. But here's the thing - don't just label them "Start" and "End" because that's pretty useless. Be specific! Something like "Raw Steel Delivery" or "Packaged Product to Warehouse" tells people what's actually happening. This way anyone looking at your flowchart gets the full scope right away.
So you've got rectangles for processes, circles for inspections, and triangles for storage. Diamonds are decision points. Arrows show which way materials flow, and those upside-down triangles mean delays or temp storage. There's also this "D" symbol for permanent storage that honestly looks kinda clunky but whatever, it's what everyone uses. Don't mix up the symbols though - each one means something specific. My old boss used to get super annoyed when people randomly switched them around. Stick with these standard ones and anyone can read your flowchart without scratching their head.
Honestly, start by mapping out your current process first - like, everything from raw materials to the final product. It's kind of a pain but you'll immediately see where things get stuck. Material process flowcharts are perfect for this because they show the whole picture visually. Once you have it mapped, the bottlenecks become super obvious. You can spot redundant steps, figure out better inventory levels, and actually coordinate with your suppliers instead of just hoping for the best. Plus it's way easier to explain timing issues to your team when you have a visual they can follow.
Don't overthink it - that's where most people mess up. You'll cram in every tiny detail and end up with something that looks like a subway map from hell. Talk to the actual workers first! They know all the weird workarounds and where things really get stuck. I skipped this once and had to redo the whole thing. Missing approval steps will come back to haunt you later. Start basic, then test it with your team before getting fancy. If it takes longer than 30 seconds to follow, you've gone too far. Oh, and don't build it alone at your desk - that never works out well.
Honestly, flowcharts are a game changer because everyone can see the same process laid out visually. No more "wait, I thought we did it differently" conversations during handoffs. You map out each step from start to finish, and boom - when something goes wrong or gets stuck, you can just point to that exact spot instead of trying to describe it. Way easier than explaining verbally, trust me on that one. Just make sure you actually update the thing when processes change (we're all guilty of forgetting this). Keep it posted somewhere people will see it.
Okay so basically you map out your whole process and suddenly you can see where stuff gets stuck. Like, materials pile up in certain spots or wait times get crazy long - boom, there's your bottleneck. Honestly it's kind of genius because when you're buried in the daily grind, you miss the obvious stuff. Time each step once you've got it mapped out. The cool thing is you'll spot which processes are actually choking your throughput, plus all the weird dependencies between steps. Way easier than trying to figure it out in your head.
Oh man, yeah material changes will totally mess with your flowchart. Different materials = different everything, basically. Like if you're going powder to liquid, your whole handling system changes - storage, cleanup, the works. Temperature stuff might need extra heating/cooling steps you didn't have before. Quality control gets weird too since testing requirements shift around. Honestly I'd start by listing out the new material's quirks first, then just go step by step through your current process. See what breaks and fix it. Way less headache than trying to do it all at once.
Honestly, you've gotta treat data collection like it's feeding your flowcharts - because it literally is. Grab cycle times, material quantities, equipment performance, all that stuff on a regular schedule. Weekly works for most places, monthly if things don't change much. Here's the thing though - operators are always tweaking stuff on the fly, and those little changes matter just as much as the official ones. Without fresh data coming in, your flowcharts turn into pretty wall decorations that nobody trusts. Set up something simple to funnel updates back into your charts. Trust me, outdated flowcharts are worse than no flowcharts.
Honestly, material process flowcharts work great as your starting point for any of those methodologies. Think of it like having a roadmap - you can see exactly where stuff moves, gets stuck, or changes hands. With Lean, just overlay your value stream mapping on top to catch waste. Six Sigma? Perfect for marking where you'll measure things and spot potential problems. Kaizen teams can literally walk through each step during their gemba walks (which is pretty cool actually). Just map out how materials flow right now, then pick whichever approach fits what you're trying to fix.
Honestly, feedback loops are game-changers for any process. You're basically creating checkpoints where your system can look back and say "wait, that didn't work" instead of charging ahead blindly. It's like having a built-in reality check - your process learns from what actually happened, not just what you hoped would happen. Skip this step and you'll be catching problems way too late, after you've already wasted time and resources. I always tell people to hunt for spots where you can loop information back to earlier steps. Sounds nerdy but it works.
So industry standards are basically the rulebook for your flowcharts - they tell you which symbols to use, how to lay everything out, all that stuff. ISO 5807 and ANSI are the big ones. They specify what shapes mean what processes, decision points, safety protocols, the works. Honestly it's pretty boring at first but everyone in your field will know how to read your charts. Plus you won't get dinged later for missing compliance stuff or quality checkpoints. My suggestion? Just grab the standard doc for your industry and keep it open while you work. Way easier than going back to fix everything later - learned that the hard way.
Honestly, manufacturing companies get the most value from these flowcharts. Auto plants, pharma companies, food processors - they all use them because their processes are super complex. One screw-up can cost millions, which is terrifying when you think about it. Steel mills and mining operations love them too since they prevent bottlenecks. Oh, and waste management facilities rely on them heavily for safety reasons. Basically, if you're turning raw materials into finished products through multiple steps, these charts will show you exactly where you're bleeding efficiency. They're worth the investment.
-
Great templates that you can use in your next keynote or conference. They are perfect for quick and visually-engaging delivery.
-
“Superb. What a great finding. Thankful for SlideTeam. We were paying people to make slides which went all in vain. We are so happy to have found you.”