





 0 Comment
 Customer Reviews

Affiliate marketing is a win-win scenario - the merchant wins, the affiliate wins, and the customer wins. - Rae Hoffman
Imagine not being aware of your successful partners, the sources of your website visits, or the number of profits from your campaigns. To avoid this, an affiliate marketing dashboard serves to be the perfect tool.
The process starts by using the right affiliate marketing instruments, which organize everything. Managing an affiliate program, including signing up new partners and setting how commissions are paid, is straightforward. Real-time monitoring of affiliates is possible with a dashboard, so you are aware of clicks, conversions, and pay outs.
With the help of the affiliate reporting tools, you can learn why some strategies succeed. To enable this, the dashboard gives an overview of rising trends, leading affiliates, and any obstacles with specific statistics from affiliate marketing.
Check our blog on the Top 10 Affiliate Program Templates to improve the management of your affiliate analytics.
The dashboard software not only informs partners but also helps them reach their goals. It offers guidance and advice needed to boost your affiliate program successfully.
Discover the Best Affiliate Marketing Plan Templates to get started with your affiliate strategy seamlessly & confidently.
SlideTeam’s dashboards are here to provide useful insights. Remove uncertainty by using data to guide your decisions, track your affiliates’ performance, and handle your program easily.
These templates allow you to track clicks, conversions, and commissions in a straightforward way to ensure you monitor everything with care. As soon as you know your affiliate marketing metrics, all your activities become planned and effective. It only takes one click to download the customizable templates, which are made for your ease.
Lets have a look at these templates.
Find our Top 10 Content Marketing Dashboard Templates built to track, analyze, and optimize content strategy efficiently in your organization.
Template 1: Marketing Dashboard PPT
This PowerPoint deck presents marketing dashboards that will aid you in efficiently delivering your message. It showcases an e-commerce marketing KPI dashboard to evaluate sales performance and a digital marketing dashboard for better visibility. It also covers PPC, SEO, and email marketing KPI dashboards for tracking & optimization of work. The template focuses on social media, CMO, and enterprise marketing dashboards to provide campaign or platform-level views in addition. This PPT deck adds value to marketing managers, affiliate program managers, and analysts to amplify affiliate campaign management and enhance affiliate marketing insights by keeping a tab on affiliate KPIs.
[product_image id=579252]
Template 2: Dashboard to Track Effectiveness of Affiliate Marketing Program
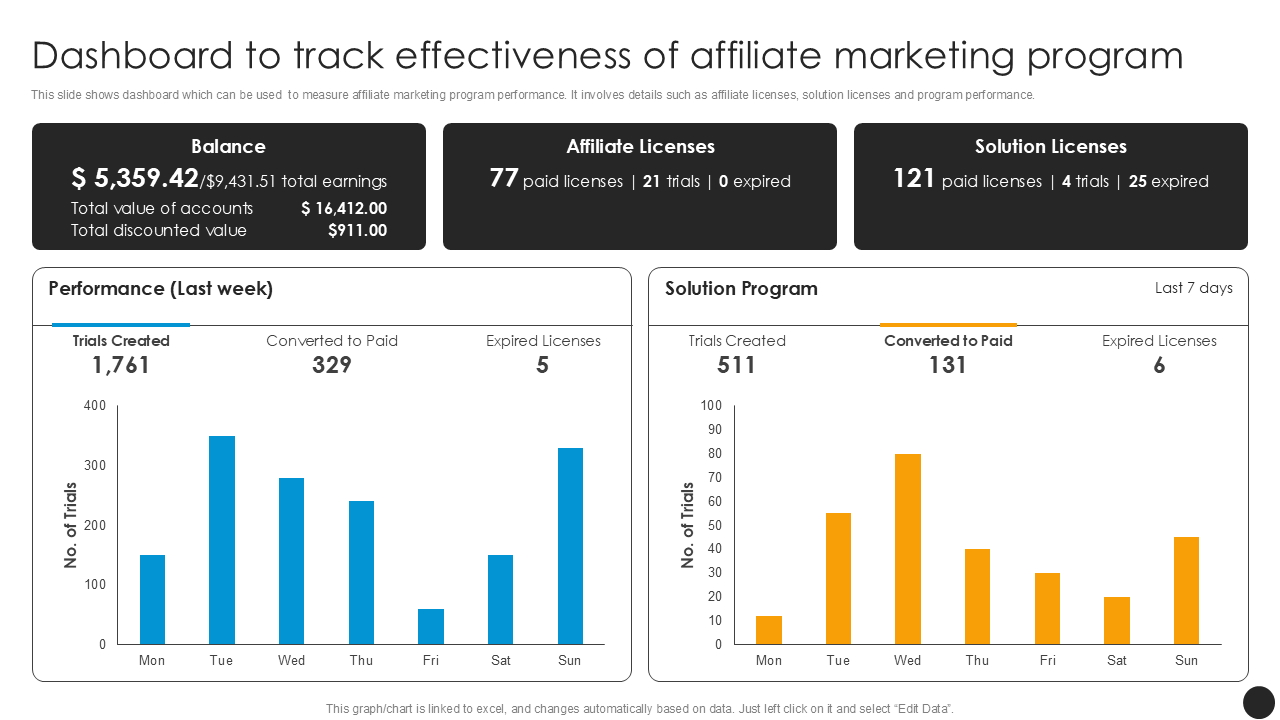
This presentation template has a robust dashboard to monitor how your affiliate marketing program is performing. It focuses on critical metrics like balance, affiliate licenses, and solution licenses. It also includes the PowerPoint slide performance from last week (1761 trials created, 329 paid, and 5 licenses expired). The template presents the solution program, indicates 511 trials, 131 conversions, and 6 expiries. This PPT design is good for affiliate managers, marketing analysts, or program leads. It is centered on affiliate program management and keeping track of what matters. Download now.
Template 3: Dashboard To Track Affiliate Marketing Program Performance
This presentation layout showcases a dynamic dashboard designed to track affiliate marketing program performance. It begins with metrics such as balances, affiliated licenses, and solution licenses being used. The PPT layout also indicates that in the last seven days, the affiliate program has witnessed 1,550 trials, 327 conversions, and 3 expired licenses. The Solution Program has seen 421 trials, 119 conversions, and 6 expired licenses. This PowerPoint diagram is useful for affiliate marketers, growth managers, and marketing analysts. Download it now.

Template 4: Affiliate Marketing Dashboard with Click and Conversion Analysis
This PowerPoint visual presents a powerful affiliate marketing dashboard built exclusively for comprehensive click advisory and conversion analysis. It includes clicks, CTR, cost, CPC, conversions on a website, and conversion rates depending on the collection of data from Google Ads, Facebook Ads, LinkedIn, and Twitter. In addition, the PPT diagram illustrates that 50% of the clicks and 70% of the conversions come from Google Ads, while LinkedIn captures 5% and 8%, respectively. This visual is made for digital marketers, affiliate managers, and media buyers.

Template 5: KPI Dashboard to Assess Effectiveness of Affiliate Marketing Program
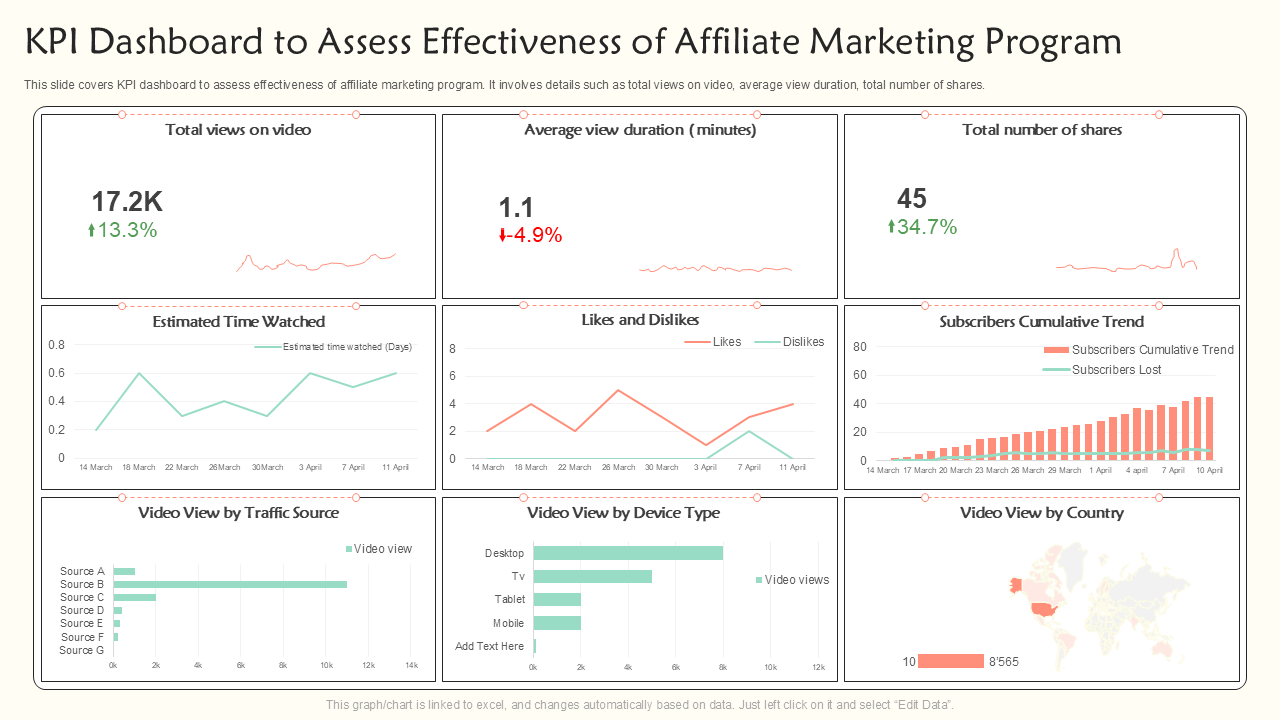
Here is a PPT layout Key Performance Indicators (KPI) dashboard to evaluate your affiliate marketing. It presents KPIs such as Total Views (17.2k with a +13.3% increase), Average View duration (1.1 minutes), Shares Channel (45 and up by 34.7%), and Estimated Time of View. The presentation slide also includes data such as Likes or Dislikes, subscribers cumulative trends, Traffic Source, Device Type & views by country. This PowerPoint framework is useful for affiliate marketers, content strategists, and those managing a digital campaign. Download now.
Template 6: Dashboard to Evaluate Effectiveness of Affiliate Marketing Program
This presentation displays a dashboard that helps you check how well your affiliate marketing program is doing. It shows net earnings of $5,234.21/$9,333.42 on a $15,321.00 account with a $901.00 discounted value. The PowerPoint template also presents elements like affiliate licenses (76 paid, 20 trials) and solution licenses (120 paid, 3 trial, 24 expired). Also, it monitors weekly performance wherein the affiliate conversion rate is 317 versus 1,650 trials. This presentation graphic is helpful for affiliate managers, marketing analysts, and growth strategists. Download now.

Template 7: KPI Dashboard to Analyze Affiliate Marketing Program
This PPT visual presents a KPI dashboard to study your affiliate marketing video engagement metrics at a granular level. It elements like 17.2k views, average view depth (1.1 mins), shares (45), and the average time spent watching the video. The presentation template also presents likes & dislikes, subscribers' cumulative trend, video views on each traffic source (A–G), device type (Desktop, TV, Tablet, Mobile), and view by country. It is suitable for affiliate marketers, video content strategists, and campaign managers. Download now.

Template 8: Dashboard To Track Affiliates’ Monthly Performance
This PowerPoint template exhibits a dashboard to monitor the monthly performance of affiliates. It evaluates metrics such as Affiliates, Leads, and Conversions by month. It also has more detailed instrumental indications such as Logged In, Logged In percentage, Submitted free sign-up, Submitted Paid Sign-up, and Paid Sign-up percentage. The PPT slide is good for affiliate programs, performance marketers, and sales analysts. It uses affiliate marketing KPIs and sound affiliate-tracking solutions, plus deep reporting of affiliate sales to make better decisions about campaign growth. Download now.

Download This Presentation Now
Template 9: Flow chart for Tracking Affiliate Marketing Efforts
The presentation design presents a flowchart for tracking affiliate marketing activities. It illustrates customer interaction with the affiliate or network, the affiliate tracking software, and the brand. The layout visually demonstrates lead and conversion flow through the system, thereby ensuring the system's transparency and accuracy at every stage. This PPT graphic is an ideal presentation tool for affiliate marketers, digital strategists, and campaign managers. Download now.

Template 10: Pinterest Affiliate Marketing Analytics KPI Dashboard
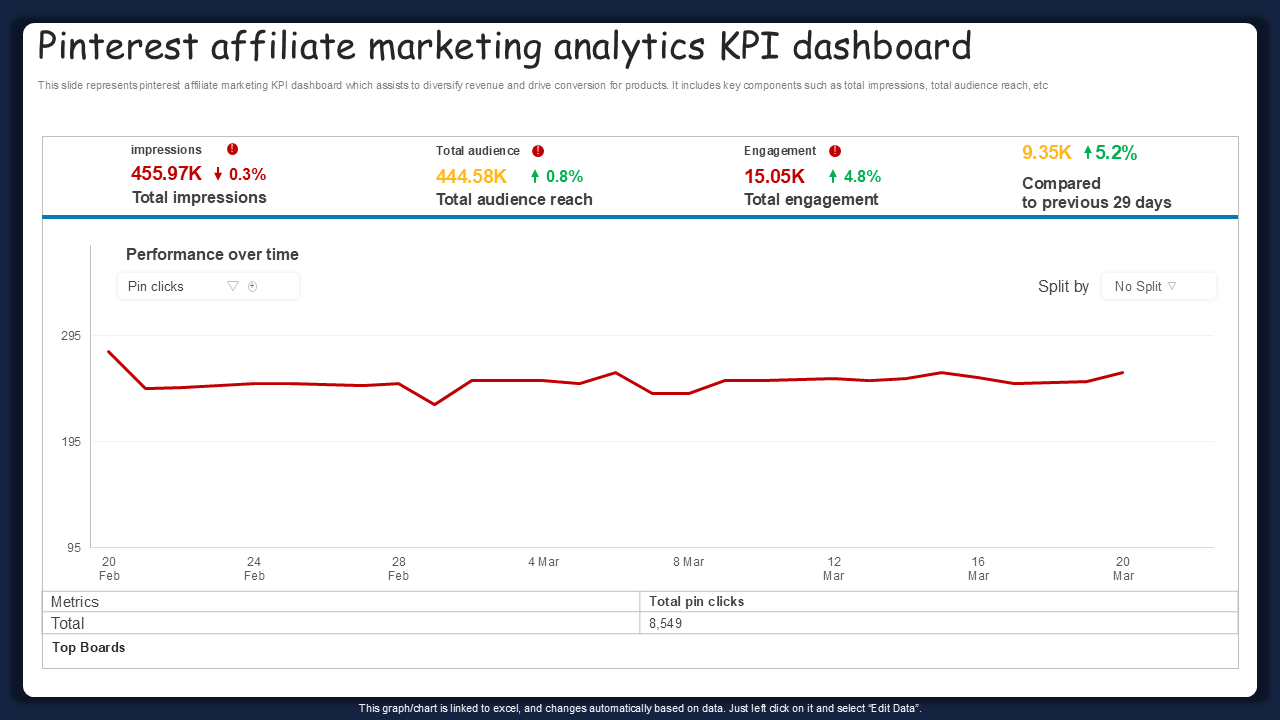
This presentation framework presents a Pinterest affiliate marketing analytics KPI dashboard. The forecasted features of this presentation slide are performance measures such as Impressions (455.97K, down 0.3%), Total Audience (444.58K, up 0.8%), Engagement (15.05K, up 4.8%); Pin Clicks (8,549, up 5.2%) in addition to performance precision monitoring. Time performance metrics are also included in the PowerPoint dashboard. It is ideal for affiliate marketers, social networking analysts, and managers of digital campaigns. Download now.
Insights That Drive Affiliate Growth
Performance marketing relies heavily on the importance of affiliate marketing dashboards. They’re not only visual representations; they also help you understand your affiliate strategy better. Affiliate performance tracking, effective analytics, and simple management tools allow you to manage your campaigns with assurance. Now, you don’t have to deal with details; these easy-to-use templates handle the work, giving you the time to focus on development and accomplishing results.
FAQs
What performance metrics are tracked on the dashboard?
A performance dashboard covers metrics and key performance indicators (KPIs) to view and interpret the performance of an organization. Metrics will vary from dashboard to dashboard, but common examples include goals and specific metrics such sales, customer satisfaction, published support, and operational efficiency.
How are clicks, conversions, and commissions visualized?
Clicks, conversions, and commissions can be visualized via charts or graphs to see trends, group differences, and distributions. Line charts can be used to present trends over time, and bar charts, for listinh rankings or distributions.
How is affiliate performance compared across campaigns?
Using the Key Performance Indicators (KPIs) such as CTR, conversion rate, and Cost per lead, the performance of an affiliate campaign compares against the Benchmark. These are metrics that help you understand which campaigns drive most of the traffic, conversions, or sales to optimize your affiliate program.


