


 0 Comment
 Customer Reviews

If you embark on a fitness journey, you must go to the gym or buy equipment and work out at home with a trainer. If your goal is to lose 10 kg, then you must follow a regime. It helps you track your progress with respect to the various exercises you do: monitor the number of push-ups, pull-ups, steps on the treadmill, and skips with the rope. Without tracking your daily activities, you cannot know where you are on your fitness journey!
Tracking the progress is crucial to reveal insights into your performance, strengths, and areas for improvement. Imagine having access to the top 10 world-class tracking metrics templates—it's like having a secret path to success that no one knows until you reveal it.
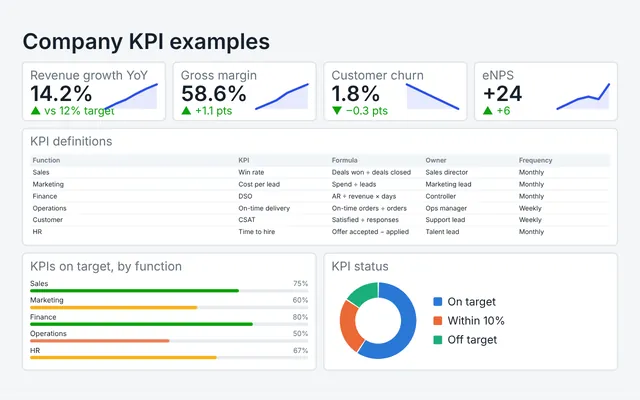
Whether it is performance metrics or KPI tracking, data monitoring, or analytics tracking, these 100% editable and customizable templates represent it all. Get real-time statistics and empower yourself to make informed decisions and adjust the courses of your journey.
Get strategic management PPT Templates to achieve your business goals and stay ahead of the competition.
Let’s Explore!
Template 1: Dashboard for Risk Communication Planning and Key Metrics Tracking
This slide shows a dashboard for planning risk communication and key metrics monitoring. It includes a risk heat map, risk classification, tactical objectives, control effectiveness, critical risks, and so on. The classification of risks includes complaint, monetary, operational, and tactical. Comprehending risks helps you be well aware of how you or your organization performed, your strengths, and domains for improvement. This metrics dashboard helps monitor risks, identify patterns, and resolve issues.

Template 2: Executive Metrics Dashboard to Track Sales Performance
This slide represents the CEO dashboard for the performance tracking of an organization's sales. It includes key performance indicators such as total sales gross profit, operating profit, net profit, sales by product and category graph, actual sales versus target graph, income statement, net operating cash flow, monthly sales growth, employee cost versus sales, headcount, days receivable outstanding and days inventory outstanding. Have this slide in your PPT to give a complete picture of your organization's sales.

Template 3: Agile Team Performance Tracking Metrics Dashboard
This slide represents the dashboard for measuring agile team management performance indicators. It also includes team responsibility, job summary by resource, planned versus actual task completion by project, job by status, total employed work hours, planned hours versus utilized hours by resource, and bug status based on priority. The dashboard provides a detailed, real-time overview of the team's productivity and tracks its progress. It ensures transparency among the team members and fosters trust.

Template 4: Executive Metrics Dashboard for Tracking Financial Health of Enterprise
This slide represents the CEO dashboard, which tracks the organization's financial health. It includes revenue, expense, activity ratio, quick ratio, gross profit margin, EBIT, financial overview, and a graph that represents cash flow and operating income. This dashboard helps leadership make informed decisions by identifying potential risks related to the company's financial health. It also ensures proper allocation of monetary resources and workforce, driving the organization towards sustained growth.

Template 5: Portfolio Dashboard Showing Budget Tracking Metrics
This slide focuses on a portfolio budget tracking dashboard that shows a portfolio summary, which includes planned budget across portfolios, used budget across portfolios, used budget percentage, estimated cost across portfolios, actual cost across portfolios, portfolio summary, and other details. It provides a view of the financial performance of multiple projects within a company and enables the leadership to monitor budgets in real-time. It also ensures that leaders spend the optimum budget on planning resources and executing the tasks.

Template 6: Project Tracker Dashboard with Multiple Metrics
The slide highlights the project management KPIs to avoid deviations. It includes elements such as project summary, schedule, task names, issues assessment, risks analysis, and a graph that represents projected budget analysis. It provides an overall view of the project's performance and status in real-time. It also ensures that the project is aligned with the set budget and highlights any loopholes. It enables the project to be carried out efficiently with enhanced visibility.

Template 7: KPI Metrics Dashboard to Effectively Track Cyber Threat Management
The purpose of this slide is to highlight the KPI dashboard used to monitor cyber threat management. It includes elements such as monthly threat status, current risk status, threats based on role, threats by owners, risk by threats, and threat report. This tracking system enables us to detect trends in cyber threats and helps us to be prepared to tackle them. It also promotes visibility and reliability across security teams and enables informed decision-making among the leaders.

Template 8: Determine Workforce Training Performance Tracking Dashboard
This slide provides information on workforce training, a performance tracking dashboard with training cost, number of participants, hours of training, and key cost metrics that encompass total trained, uniquely trained, totally initiated, total cost YTD, etc. It offers a clear view of employee development and skills enablement. These programs are generally aligned with company goals, helping to identify loopholes and resolve them. This dashboard makes it easy to monitor individual and team progress.

Template 9: Metrics to Track the Effectiveness of Integrated Digital Marketing Campaign
It includes metrics such as traffic generation, average time spent, lead conversions, social media marketing results, and return on investment. It also includes a description of metrics, measures, and improvement strategies. This data-driven approach helps marketers track their progress and adjust their strategies. It also ensures the proper allocation of funds needed to target specific audiences and improve business.

Template 10: Content Marketing Metrics to Track Social Media Status
This slide shows the dashboard that represents content marketing metrics for tracking social media status. These metrics include page visits, post overview, total page links, followers by gender and country, page summary, click actions on the page, most recent posts, post reach, etc. Knowing these metrics is important for determining how social media content performs. One can track their daily, monthly, and annual progress using this metric system.

Over to you!
Here's the key takeaway: By now, you will have understood the role of metrics in ensuring the success of your company by knowing its financial health. Preparing a PPT from scratch could be energy-draining and time-consuming, as this topic contains various aspects common to most industries. Why worry when you have PPTs handy? Don't wait! Download our PowerPoint PPT bundles and make a difference to your business now!