Executive Metrics Dashboard For Tracking Financial Health Of Enterprise

Rating:
100%
Executive Metrics Dashboard For Tracking Financial Health Of Enterprise
Slide 1 of 7

or

Favourites Favourites

Try Before you Buy Download Free Sample Product

Audience Impress Your
Audience
Editable 100%
Editable
Time Save Hours
of Time
The Biggest Sale is ending soon in
0
0
:
0
0
:
0
0
Rating:
100%
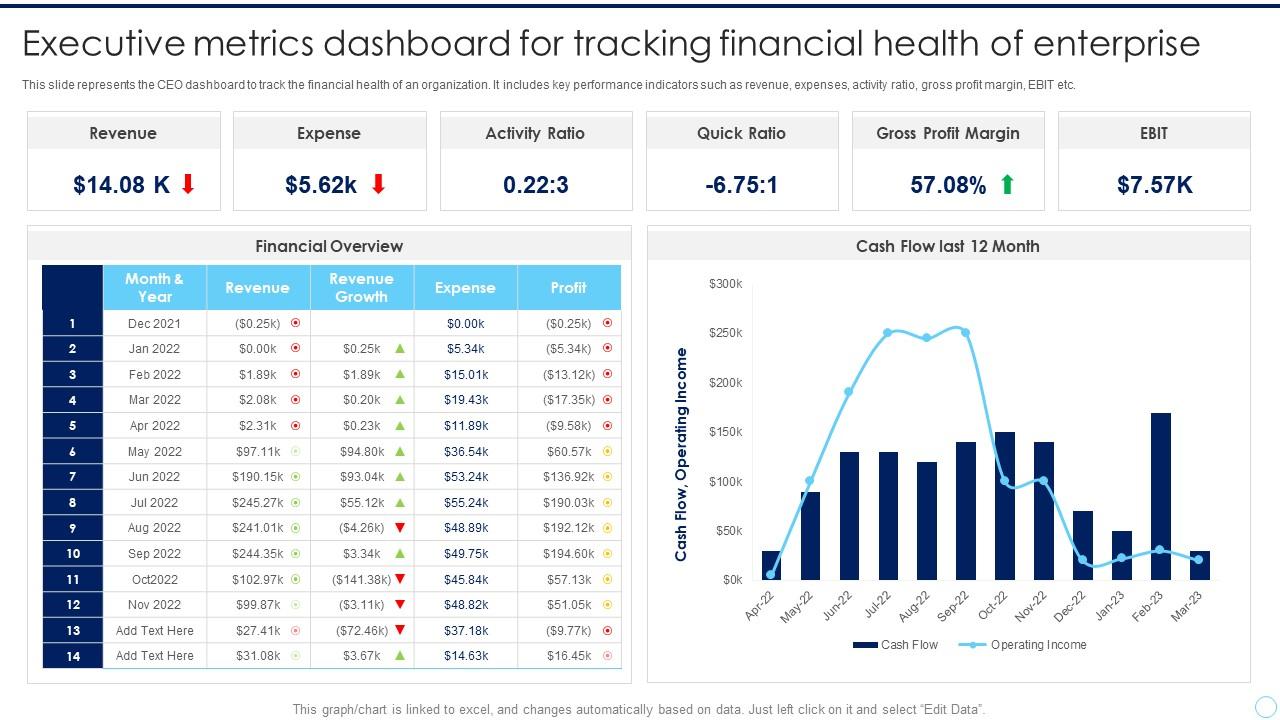
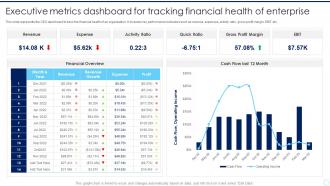
This slide represents the CEO dashboard to track the financial health of an organization. It includes key performance indicators such as revenue, expenses, activity ratio, gross profit margin, EBIT etc. Presenting our well structured Executive Metrics Dashboard For Tracking Financial Health Of Enterprise. The topics discussed in this slide are Revenue, Expense, Activity Ratio, Quick Ratio. This is an instantly available PowerPoint presentation that can be edited conveniently. Download it right away and captivate your audience.

FAQs for Executive Metrics Dashboard For Tracking Financial

Executive Metrics Dashboards should include revenue growth rates, operational efficiency ratios, customer acquisition costs, employee productivity metrics, and cash flow indicators. These KPIs enable executives to monitor strategic performance across departments, identify emerging trends, and make data-driven decisions, with many organizations finding that integrated dashboards streamline reporting while enhancing competitive advantage through real-time visibility.

Visualization techniques enhance executive dashboard metrics by transforming complex data into intuitive charts, graphs, heat maps, and trend lines that enable rapid pattern recognition and decision-making. Through strategic use of color coding, comparative visualizations, and interactive elements, executives can quickly identify performance gaps, emerging opportunities, and critical issues, ultimately streamlining strategic responses and improving organizational agility.

Real-time data integration enhances Executive Metrics Dashboard effectiveness by eliminating data delays, providing current performance insights, enabling immediate decision-making, and facilitating proactive issue identification. Through continuous data streaming, executives can monitor KPIs instantly, respond to market changes swiftly, and track operational metrics dynamically, ultimately delivering competitive advantage and strategic agility.

User customization enables executives, department heads, and analysts to tailor dashboards to their specific KPIs, reporting needs, and decision-making priorities, ensuring relevant data visibility across organizational levels. Through personalized widgets, filtered views, and role-based access controls, stakeholders can focus on metrics most critical to their responsibilities, ultimately enhancing operational efficiency and strategic alignment.

Organizations ensure dashboard data accuracy through automated data validation, real-time integration protocols, standardized data governance frameworks, regular audit processes, and source system verification. These mechanisms streamline data quality by eliminating manual errors, establishing consistent definitions, and maintaining transparency across departments, with many executives finding that robust validation processes ultimately deliver more confident decision-making and strategic insights.

**INPUT**: What industries benefit the most from customized Executive Metrics Dashboards, and why? **OUTPUT**: Healthcare, financial services, manufacturing, retail, and technology sectors benefit most from customized executive metrics dashboards due to their complex operational requirements and regulatory demands. These industries leverage dashboards to streamline decision-making, enhance operational efficiency, and maintain competitive advantage, with many organizations finding that real-time visibility into KPIs accelerates strategic responses and ultimately delivers measurable business outcomes. **Word count: 60 words**

Dashboard design significantly impacts engagement through intuitive navigation, clear visual hierarchies, personalized metrics displays, and mobile responsiveness that executives expect. Well-designed dashboards with clean layouts, relevant KPIs, and drill-down capabilities see higher adoption rates across organizations, with many finding that user-friendly interfaces ultimately deliver faster decision-making and sustained executive usage.

Common pitfalls include information overload, lack of real-time data integration, poor visual hierarchy, misaligned KPIs, and insufficient stakeholder input during development. These challenges can undermine dashboard effectiveness by creating confusion, delayed decision-making, and reduced executive adoption, with many organizations finding that focused metrics and intuitive design ultimately deliver greater strategic value.

Organizations balance dashboard depth and clarity by implementing layered information architecture, progressive disclosure features, and role-based customization that presents high-level KPIs upfront while enabling drill-down capabilities. Through strategic use of visual hierarchy, interactive filters, and contextual data storytelling, companies like financial services firms and healthcare systems deliver comprehensive insights without overwhelming users, ultimately enhancing decision-making speed and executive engagement.

Effective tools for executive dashboards include Tableau, Power BI, Qlik Sense, Looker, and Google Data Studio, each offering real-time analytics and customizable visualizations. These platforms streamline data integration from multiple sources, enhance decision-making through interactive reporting, and deliver scalable solutions, with many organizations finding that cloud-based options provide faster deployment and better cross-departmental accessibility.

Mobile compatibility is critically important for Executive Metrics Dashboards in remote work environments, enabling real-time decision-making, seamless accessibility across devices, and continuous business oversight regardless of location. With executives increasingly working from various locations, mobile-optimized dashboards streamline operations by delivering instant access to key performance indicators, facilitating faster response times, and ultimately maintaining competitive advantage in an increasingly distributed workplace landscape.

Regular maintenance strategies include establishing automated data refresh cycles, conducting quarterly metric relevance reviews, implementing stakeholder feedback loops, and aligning updates with evolving business priorities. These approaches streamline dashboard accuracy by ensuring real-time data integration, removing outdated KPIs, and incorporating emerging performance indicators, with many organizations finding that systematic maintenance schedules ultimately deliver enhanced decision-making capabilities and sustained competitive advantage.

An Executive Metrics Dashboard facilitates cross-departmental collaboration by providing unified visibility into shared KPIs, standardized reporting formats, and real-time performance data across all business units. Through centralized dashboards, departments can identify interdependencies, align strategic objectives, and coordinate resource allocation more effectively, with many organizations finding that transparent metrics eliminate silos and accelerate decision-making processes.

Data privacy and compliance in Executive Metrics Dashboards require role-based access controls, end-to-end encryption, audit trails, regular security assessments, and adherence to regulations like GDPR and HIPAA. These measures work together by restricting data visibility to authorized personnel, protecting information during transmission and storage, and maintaining comprehensive logs, with many organizations finding that proactive compliance frameworks ultimately deliver enhanced stakeholder trust and competitive advantage.

Executive Metrics Dashboards assist long-term strategic planning by providing trend analysis, predictive insights, scenario modeling capabilities, and real-time performance tracking against strategic objectives. These comprehensive tools enable executives to identify emerging market opportunities, allocate resources strategically, and adjust long-term goals based on data-driven forecasts, ultimately delivering competitive advantage and informed decision-making.

Ratings and Reviews

100% of 100
Review Form
Write a review
Most Relevant Reviews
  1. 100%

    by Dudley Delgado

    Their products can save your time, effort and money. What else you need. All in one package for presentation needs!
  2. 100%

    by Connie Simmons

    My search for complete decks ended with SlideTeam. Such a surplus collection of HD PowerPoints. Moreover, their standard and widescreen formats have helped me in delivering bullseye presentations.

2 Item(s)

per page: