


Project Tracker Dashboard With Multiple Metrics




Try Before you Buy Download Free Sample Product
 Impress Your
 Audience
 100%
100% Editable
 Save Hours
 of Time


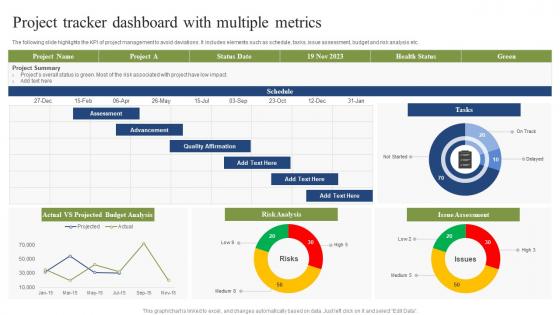
The following slide highlights the KPI of project management to avoid deviations. It includes elements such as schedule, tasks, issue assessment, budget and risk analysis etc.
People who downloaded this PowerPoint presentation also viewed the following :
Project Tracker Dashboard With Multiple Metrics with all 7 slides:
Use our Project Tracker Dashboard With Multiple Metrics to effectively help you save your valuable time. They are readymade to fit into any presentation structure.






FAQs for Project Tracker Dashboard
Honestly, just focus on the basics first - timeline, budget, and scope creep. Those three will tell you if you're in trouble. Team velocity is huge too, like are people actually getting stuff done or just spinning their wheels? Quality metrics help - defect rates, client feedback, whatever makes sense for your project. Stakeholder happiness is annoying to track but super important because they can kill your project even if everything else looks good. Don't go crazy though. Pick maybe 4-5 things max and check them weekly. I made the mistake once of tracking like 15 different things and it was useless.
Honestly, these tools are game-changers for keeping everyone on the same page. No more of those awkward "so... how's that project going?" conversations because you can actually see who's doing what and when stuff's due. Real-time updates mean less meetings too, which is huge. Plus you can catch problems before they blow up into actual disasters. My advice? Don't go crazy with features right away - just pick something simple and make sure everyone actually uses it first. I learned that the hard way when half my team ignored our fancy setup for like three months.
Honestly, real-time data is a game changer for projects. You'll catch budget issues or delays as they're happening instead of finding out a week later when it's too late to fix anything. Way better than those painful weekly meetings where everyone's like "oh yeah, we've been stuck on this for three days." Short bursts of current info beat outdated reports every time. Set up some auto-updating dashboards so people can see task progress and timeline changes without bugging each other constantly. Makes decisions way easier when you know what's actually going on right now, not what happened yesterday.
Start with simple priority levels like High/Medium/Low or P1/P2/P3 - whatever clicks for you. High-impact, low-effort stuff goes straight to the top. Don't let every single thing become "urgent" though, or your whole system falls apart (learned that one the hard way). Deadlines obviously count, but also think about dependencies. Some tasks literally can't start until others finish. Oh, and here's the thing everyone messes up - you can't just set priorities once and call it done. Things shift constantly, so update them as you go. Being consistent with your criteria is what actually makes this work.
Dude, don't track every little thing - that's how teams burn out. I've literally watched projects die from tracking fatigue. Weekly check-ins work way better than constant updates. Focus on stuff that actually moves the needle, not busy work that looks productive but isn't. Milestones and real deliverables matter more than subtasks. Oh and make sure you're measuring progress toward business goals, not just... activity? Teams hate micromanagement. Keep it simple or you'll spend more time tracking than doing actual work.
So Gantt charts are basically visual timelines for your whole project. You'll see what's happening when and catch issues before they become disasters. Really helpful for tracking which tasks depend on others finishing first - that's where most projects get messy, honestly. When something runs late, you can instantly see how it'll affect everything else down the line. Your team gets it immediately without you having to explain a bunch of details. I'd start with just the big milestones first, then add more as you go. Way less overwhelming that way.
Ditch those old milestone reports and focus on sprints instead. Burndown charts are your friend - they show progress way better than tracking hours. Daily standups honestly beat those painful weekly meetings every time. Story points matter more than time spent, trust me on this. Get a kanban board going (Jira's fine, even Trello works). Watch your velocity trends so you can actually predict what's doable next sprint. Oh, and you'll spot blockers super early this way, which saves everyone headaches later.
Start with utilization rates - that's how you'll catch if someone's drowning or twiddling their thumbs. Budget variance percentage is huge too, shows you if money's flying out the door. I always check planned vs actual hours because scope creep will sneak up on you every time. Cost per deliverable matters, plus how long stuff takes compared to your original estimates. Oh, and track bottlenecks - like who's waiting on what and why. Weekly check-ins work well to start. You can dial it back once you figure out your patterns.
Dude, tracking is like having a crystal ball for your projects. When deadlines start creeping or budgets get weird, you'll see it coming instead of getting blindsided later. I learned this the hard way on my last big project - wish I'd been watching the warning signs earlier. You can catch stuff while it's fixable rather than when everything's already a dumpster fire. Plus the data shows you patterns so next time you're not walking in blind. Honestly just pick 3 or 4 things that actually matter and watch those religiously.
Honestly, start with task management - you need something where you can assign work, set deadlines, and track how everything connects. Real-time chat and file sharing are huge too, plus @mentions so people actually see updates. The dashboard stuff is where most tools either shine or totally suck, so pay attention to that during demos. Time tracking and budget features matter if you're watching resources closely. Oh, and dependencies - that's probably more important than I initially thought. List out what's driving your team crazy right now, then test 2-3 options that actually fix those specific problems.
Honestly, good stakeholder communication is like half the battle for project tracking. Regular updates mean people actually tell you when stuff's going sideways before it becomes a disaster. You'll get real feedback about roadblocks instead of nasty surprises later. The other thing - and this might sound obvious but whatever - everyone needs to agree on what "on track" even means. I've watched projects totally implode because people had wildly different ideas about deliverables. Set up those check-ins early and be upfront about how you're measuring things. Trust me, you'll need their buy-in when decisions get tough.
Honestly, weekly updates work best for most projects - bi-weekly if it's a longer timeline. Don't just say "making good progress" though, that drives everyone crazy. Be specific about what's actually finished vs. what you're still working on. Flag problems early too! I once waited way too long to mention a dependency issue and it bit me hard. Numbers help when you can swing it. Keep updates short and scannable - highlight wins and what's coming next. Oh, and if something major happens? Don't wait for your next scheduled check-in, just shoot them a message right away.
Honestly, tracking your project is like having a GPS instead of wandering around lost. You get real data on timeline, budget, milestones - the whole picture. Spot problems early before they explode into major headaches. Your stakeholders will actually thank you when you have solid answers instead of just shrugging. I've seen too many people make decisions based on hunches that totally backfire. Check your data weekly and you'll make way smarter calls about shifting resources or pushing deadlines. Makes such a difference in how confident you feel running things.
Honestly, looking at charts beats scrolling through endless spreadsheets any day. Your brain just processes visual stuff way better - you'll catch bottlenecks and capacity issues before they blow up. Gantt charts show if you're actually gonna hit deadlines, and stakeholders love dashboards way more than decoding rows of data in meetings (trust me on this one). Even something simple like a kanban board makes a huge difference. I'd start there and add more complex visualizations later. It's weird how much clearer everything becomes once you can actually *see* what's happening with your project.
Honestly, start with automating your weekly status reports - that'll probably save you like 3-4 hours right there. The AI stuff is actually pretty good at catching budget issues and delays way before you'd notice them manually. It tracks all the boring admin work too - deadline reminders, progress updates, chasing people for info. Super helpful for spotting resource problems before they blow up. Plus it analyzes patterns in your data to predict where bottlenecks might happen. I was skeptical at first but it really does free you up to focus on the actual problem-solving instead of just... tracking everything constantly.
-
If you are looking for satisfactory PowerPoint services, SlideTeam is your go-to place. I am fully contented with their research and development team.
-
Qualitative and comprehensive slides.