


Facility Management Dashboard For Educational Institute




Try Before you Buy Download Free Sample Product
 Impress Your
 Audience
 100%
100% Editable
 Save Hours
 of Time


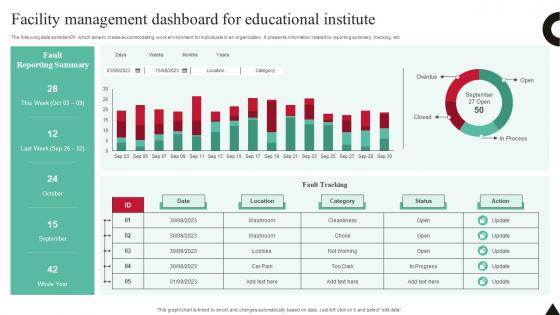
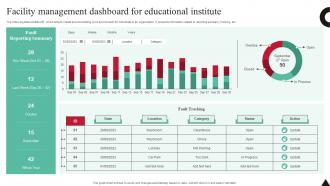
The following slide exhibits KPI which aims to create accommodating work environment for individuals in an organization. It presents information related to reporting summary, tracking, etc.
People who downloaded this PowerPoint presentation also viewed the following :
Facility Management Dashboard For Educational Institute with all 7 slides:
Use our Facility Management Dashboard For Educational Institute to effectively help you save your valuable time. They are readymade to fit into any presentation structure.






FAQs for Facility Management Dashboard
Honestly, just track what actually affects your day-to-day stuff. Space utilization and energy costs are obvious ones. Work order times matter too - nobody wants angry tenants calling constantly. I'd add maintenance costs, HVAC efficiency, and equipment uptime since catching problems early saves you tons of money later. Safety incidents and compliance status are non-negotiables. Oh, and tenant satisfaction scores if you deal with that side of things. Pick maybe 6-8 metrics max though. Trust me, more data doesn't mean better decisions if you're not actually using it.
Honestly, these dashboards are pretty sweet once you start using them regularly. Real-time data shows you what's actually happening across your whole building - energy usage, which spaces sit empty, maintenance stuff before it breaks. Way better than running around putting out fires all day. I'd focus on whatever's driving you crazy right now first, like scheduling or equipment issues - that's where you'll notice changes fast. Makes decisions so much easier when you're not just guessing. Oh and the preventive maintenance thing alone probably pays for itself.
Dude, real-time data is a total game changer for facility dashboards. You'll catch maintenance problems the second they happen instead of scrambling later. Energy spikes, space usage patterns, equipment failures - all visible instantly. I swear once you get used to seeing everything live, going back to old reports feels prehistoric. Set up smart alerts for stuff that actually impacts your bottom line. That way you're not drowning in notifications but still catching the big issues before they drain your budget. Way better than playing catch-up with yesterday's problems.
Look, if people can't figure out your dashboard, they just won't use it. Simple as that. When everything's intuitive and easy to find, your team stops wasting time digging through menus and actually gets stuff done. Nobody's got patience for clicking five buttons just to see if the AC's working. Plus you'll spend way less time training new people, and they won't mess up work orders as much. Honestly, I'd start with whatever features people use most – that's where you'll notice the difference right away. The fancy stuff can wait.
So you'll definitely need HVAC and security integrations first - that's your bread and butter. Work order management software is huge too, probably where you'll live most days. Energy monitoring tools are pretty standard now for tracking usage. IoT sensors are cool for occupancy and air quality data, though honestly some clients go overboard with them. Your building automation system ties everything together nicely. I'd stick with the basics initially. Get HVAC and security dialed in, then add the fancy smart building stuff later once you're not scrambling.
Start with data validation checks on day one - seriously, this will save your sanity later. Get your sensors calibrated properly and set up alerts for weird readings. Your team needs consistent standards for manual stuff like work orders (I've seen this go sideways so many times). Train everyone on the same input methods. Do audits every so often - compare what your dashboard shows vs what's actually happening on-site. Pick maybe 2-3 key metrics first and nail those down before you get fancy with other stuff. Don't try to track everything at once, you'll just end up with garbage data everywhere.
Group your important stuff together - energy usage, maintenance alerts, all that critical data. Don't make people dig around for it. Red means urgent, green means you're good, but honestly? Skip the crazy rainbow dashboards because they just look messy. Heat maps are clutch for showing space usage, and those simple gauge things work perfectly for temperature or how many people are in the building. Oh, and definitely test it with real facility managers first - they'll call out confusing layouts in like two seconds. Put your most actionable stuff at the top so decisions happen quickly.
Honestly, I'd go with 15-30 minute updates for most dashboard stuff. Real-time everything sounds cool but it's total overkill and will just slow things down. Security alerts and HVAC breakdowns? Yeah, those need instant notifications obviously. But energy usage and occupancy data? An hour between refreshes is totally fine. I always tell people to start at 30 minutes then tweak it based on what your team actually looks at. There's no point refreshing data every 5 minutes if nobody checks it that often anyway.
Real-time alerts are clutch - you need those hitting your phone immediately. QR code scanning for assets is a game changer when you're walking around the facility. Quick work order creation too, obviously. Visual dashboards help when you're checking between meetings, but honestly the photo upload thing is what really matters. Half these systems still suck at it somehow? Fast search and filtering are non-negotiable. Oh, and don't get distracted by fancy features until you've nailed these basics first. Trust me on this one.
So predictive analytics basically looks at your old data to guess what's coming next. You'll catch equipment failures before they happen instead of scrambling when stuff breaks. Space usage patterns become way clearer too - honestly, I was surprised how much money that saves on energy costs. Focus on your biggest pain points first, like HVAC or elevators. Then you can expand to forecasting occupancy trends and scheduling maintenance weeks ahead. It's pretty much having a heads up on everything that usually blindsides you. Makes the whole operation feel less chaotic, you know?
Honestly, the worst part is gonna be connecting all your scattered data systems - they never want to talk to each other. Getting your team to actually use it is brutal too. People hate changing how they work, especially if they're not super comfortable with tech. Start with just one or two connections instead of trying to do everything at once (learned that the hard way). Also figure out what numbers actually help you vs just look cool on a dashboard. Oh, and definitely get your most respected team members on board first - makes everything way easier.
Honestly, these dashboards are game-changers for sustainability stuff. Real-time data on energy, water, waste - you'll catch weird spikes right away. Like when accounting is somehow burning 30% more power than everyone else (classic). Set up alerts so you're not blindsided by massive bills later. The cool part? You can actually see which green initiatives work vs the ones that just sound impressive in meetings. Carbon tracking becomes way easier too. HVAC performance, consumption patterns - it's all there. Just don't get overwhelmed by all the data at first.
Honestly, your team won't use the dashboard if they don't know how to work it. People either completely ignore systems they're confused by or they'll misread the data - which is kinda worse than not using it at all. Show them the basics first: how to navigate around, customize their views based on what they actually need to see. The big thing though? Teaching them what the numbers actually mean so they can make decent decisions. Oh, and definitely do hands-on training sessions. Let them mess around with real examples they'll see every day - that's way better than boring demos.
Honestly, dashboards are a game-changer for compliance stuff. You can track everything automatically - safety inspections, maintenance, environmental data, audit trails - without losing your mind. When auditors show up (ugh), you'll actually have reports ready instead of panic-searching through random spreadsheets. They'll alert you before deadlines hit too, so no more "oh crap, that permit expired last week" moments. Trust me on this one - set up your compliance KPIs now and you'll thank yourself later during reviews.
Honestly, AI integration is where everything's heading - your dashboards will start predicting when stuff breaks before it actually does. Pretty crazy how IoT sensors are in literally everything now, so you're getting real-time data from places you didn't even know existed. Everyone wants mobile access since nobody's stuck at their desk anymore. AR is starting to pop up too - you can point your phone at equipment and boom, instant data overlay. My buddy's company just switched to an AI-powered system and he won't shut up about the cost savings. I'd start looking at vendors with solid analytics now before you get left behind.
-
Very well designed and informative templates.
-
Editable templates with innovative design and color combination.