


Facilities Management Dashboard Highlighting Organization Consumption Office Spaces Facility Management Service




Try Before you Buy Download Free Sample Product
 Impress Your
 Audience
 100%
100% Editable
 Save Hours
 of Time


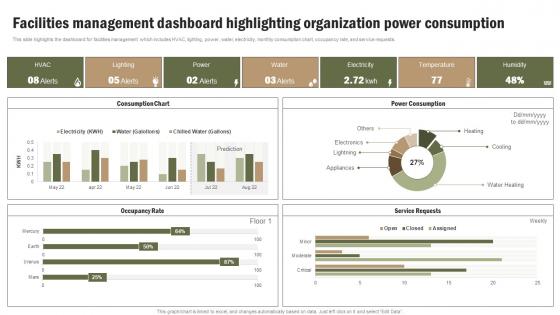
This slide highlights the dashboard for facilities management which includes HVAC, lighting, power, water, electricity, monthly consumption chart, occupancy rate, and service requests.
People who downloaded this PowerPoint presentation also viewed the following :
Facilities Management Dashboard Highlighting Organization Consumption Office Spaces Facility Management Service with all 7 slides:
Use our Facilities Management Dashboard Highlighting Organization Consumption Office Spaces Facility Management Service to effectively help you save your valuable time. They are readymade to fit into any presentation structure.





FAQs for Facilities Management Dashboard Highlighting Organization Consumption Office Spaces
Definitely focus on the big four: space utilization, maintenance costs/response times, energy consumption, and tenant satisfaction. Maintenance response time is clutch - trust me, you don't want those angry calls about broken HVAC at 2pm on Friday. Track preventive maintenance completion rates too, plus overall facility uptime. Oh and honestly? Pick metrics that actually help you decide stuff, not just numbers that look good in presentations. These core ones should get you started, then you can always add more based on what your boss or whoever actually cares about tracking.
Looking at your facilities data in charts and graphs makes everything so much clearer than staring at endless spreadsheets. You'll instantly see patterns - like which buildings waste the most energy or when maintenance calls go crazy. My old boss used to call it "facility superpowers" which sounds cheesy but honestly fits. Dashboards let you compare buildings side-by-side and even predict equipment failures before they happen. Just focus on metrics that actually matter for your decisions. Pretty colors don't help if you're tracking the wrong stuff.
Honestly, start with IoT sensors - they're what actually grab data from your HVAC, lighting, all that stuff. You'll go crazy without some kind of integration platform though, like Azure IoT Hub or AWS IoT Core, because managing those data streams manually is a nightmare. APIs let you connect whatever building management systems you've got already. For the dashboard part, Power BI or Tableau work great since they handle live feeds pretty well. Oh, and definitely check what systems you have that can already push data - that's usually your easiest win right there.
Honestly, those dashboards are pretty clutch for keeping track of everything. You get all your maintenance schedules in one spot instead of dealing with random spreadsheets scattered everywhere. Real-time updates show you what equipment needs service, plus you can follow work orders as they move along. The spending tracker is probably my favorite part - helps you figure out which machines are actually worth keeping around versus the ones that just eat money. Oh, and the automated alerts are solid too, so you won't accidentally miss something important. I'd start with notifications for your most critical stuff first.
So for your dashboard - definitely go with clear icons that don't need explaining. Let people customize their views because honestly, nobody wants to see the same stuff as their coworker. Mobile's huge since we're all glued to our phones anyway. Search bars are clutch, and drag-and-drop makes everything feel way smoother. Oh, and color-code your priority levels - saves so much mental energy. Power users will love you for keyboard shortcuts too. But here's the thing: keep it simple overall. I've seen dashboards that look like airplane cockpits and nobody touches them.
Honestly, mobile compatibility is a game changer for facilities teams. Your techs can handle work orders and check equipment status right from their phones instead of constantly running back to the office computer (which is annoying AF). Real-time alerts come through while they're actually walking the building. They'll snap photos of issues and log maintenance on the spot. Floor plans? Right there on their device. Way faster response times too since field staff and management can communicate instantly. I'd start with making sure your dashboard actually works well on phones and tablets - some are surprisingly clunky on mobile.
So basically, predictive analytics lets you see problems coming instead of scrambling when stuff breaks. Like, it'll tell you "that HVAC unit fails every 6 months" or show you Tuesdays are crazy busy for conference rooms. Pretty cool, right? You can actually plan ahead - schedule maintenance when it's slow, order parts before things break down. The system crunches all your historical data to predict when you'll need more staff or resources. I'd probably check those weekly reports to spot patterns (though honestly, who has time for that?). Way better than playing catch-up all the time.
So basically it's like having a control center for all your building's energy stuff - HVAC, lighting, water, waste management. Pretty neat actually. Instead of guessing where you're bleeding money, you get real data showing which buildings are total energy hogs and when your peak usage hits. I'd probably start with finding your biggest energy drains first, that's usually where the quick wins are. The dashboard tracks your sustainability goals too and spits out reports for the higher-ups. Honestly beats trying to piece together data from five different systems.
Honestly, it's like having a command center for all your maintenance stuff. No more endless phone calls trying to update everyone - just push real-time updates and work order statuses straight to whoever needs them. You can set different notification levels too, so your boss gets the executive summary while you and your team see all the detailed breakdown. The charts are clutch for budget meetings because you can actually show why you need that equipment replacement instead of just asking nicely. I'd probably start by figuring out who your main stakeholders are, then build their dashboard views around what they actually care about. Makes life way easier.
Data integration is going to be your biggest headache - all that HVAC, security, and maintenance stuff living in different systems that hate each other. Getting your team on board is tricky too. Half will think you're trying to automate them out of jobs. Pick maybe two metrics that actually matter instead of building some fancy executive eye-candy dashboard (trust me on this one). Oh, and facilities people can be surprisingly resistant to new tech. Start small or you'll drive yourself crazy trying to connect everything at once.
Set up some feedback loops - in-app surveys, suggestion boxes, user interviews. Quarterly focus groups with your main users work great (facilities managers, techs, daily users). Your dashboard should track which features people actually use and where they bail out. Walking around asking "how's the new dashboard going?" honestly gets you the best stuff sometimes. People are way more candid face-to-face than in surveys. Just make sure you've got a real process for acting on feedback - nothing kills participation faster than collecting input and then... crickets. Users stop caring if they don't see changes happening.
So basically you wanna match your dashboard to what actually matters in your industry. Healthcare places need patient safety stuff, infection rates, equipment uptime - plus all that HIPAA compliance tracking. Schools care more about classroom usage, campus safety, energy costs across buildings. The interface should fit how people actually work too - hospitals need alerts 24/7 but schools can focus on seasonal planning. Honestly there's a ton of options once you get into the weeds. I'd start simple though. Pick your top 5 priorities and build around those first.
Start with solid user authentication - that's your foundation. Set up role-based permissions so only the right people can see sensitive stuff like security codes or maintenance schedules. Encrypt everything, both when it's moving around and just sitting there. Your dashboard needs to be behind a VPN, definitely not hanging out on the public internet where anyone can poke at it. Session timeouts are clutch too - you don't want someone walking away from their computer with everything still logged in. Oh, and audit logs will save your butt when you need to track who accessed what. Network security honestly feels like the Wild West sometimes, but these basics will get you covered.
Honestly, get a facilities dashboard set up ASAP. You can dump all your compliance stuff in one spot instead of drowning in spreadsheets. It'll ping you when fire inspections are coming up, HVAC certs expire, that kind of thing. Trust me, you don't want to be scrambling when some inspector shows up unannounced - been there, not fun. The system keeps everything tracked so you've got solid records to show you're staying compliant. Way easier than trying to remember all those deadlines yourself.
Honestly, there's so much you can hook up to make your dashboard way more useful. IoT sensors are probably your best bet - they'll grab real-time data on temp, who's in the building, energy costs, all that stuff. CMMS systems are great for tracking maintenance and work orders. Building automation lets you control HVAC and lights right from the dashboard, which is pretty slick. Mobile apps for your field teams make reporting way less of a headache. ERP integration helps with budgets and vendor stuff too, though that's more of a nice-to-have. Just start with whatever's driving you crazy right now - that's where you'll actually see results.
-
Easy to edit slides with easy to understand instructions.
-
Very unique and reliable designs.