



 0 Comment
 Customer Reviews

Did you know some offices waste nearly 40% of their space every day? Well, if you are willing to fix that, the occupancy dashboard is here to help. Use it to track how spaces are used in real time. From room usage to occupancy rate, it is all there to improve capacity utilization without guessing.
You can also monitor daily occupancy trends to understand the peak hours. Thanks to real-time monitoring, you do not need to check rooms on your own; there are sensors for better space management and resource allocation. These dashboards also provide floor plan visualization, so that managers know what is happening on every floor. These smart desk booking systems can give your employees the freedom to manage the facilities and their operations.
To help you discuss your space strategies in an easy way, use our PPT templates. They can show complicated occupancy patterns and make the desk booking system features understandable for everyone. These documents assist you in preparing new floor plans and building efficiency reports. You can use them to pitch the capacity utilization improvements of your firm and successfully approve the proposal. You can also simplify room usage planning and design smart space management plans as per your need.
Check out these templates and learn about Capacity Planning Dashboards.
Now, let us explore our Top 10 Occupancy Dashboard Templates with Samples and Examples.
Template 1: Smart Retail Store Occupancy Detection Dashboard PPT Template
A Retail Store Occupancy Detection Dashboard can monitor how many people are inside your store in real-time. It uses smart sensors and cameras to show different parameters such as crowd levels, peak hours, and how different areas are used. To get some idea of the approach, take a look at this template and plan staffing, improve layout, and offer better service. Here, you can illustrate store traffic, occupancy levels, trial rooms, trial room occupancy, and customer behavior. The template can help store owners manage space, store layouts, and staffing levels. So, get it now!

Template 2: Business Hospitality Management Dashboard with Occupancy Rate PPT Template
A Hospitality Management Dashboard can tell you about the occupancy rate in real time and assist managers understand how well their company is doing. It can give you a clear picture of the guest activity, booking patterns, peak seasons, and overall performance. You can use the template and describe facts and figures related to hotel chain bookings and occupancy data. It includes visitors, occupancy rate, revenue, bookings comparison, occupancy type, etc. It can help plan staff shifts and services, so download the document now and make monthly reporting more professional and easier to read.

Template 3: Medical Dashboard Showing Readmission And Occupancy Rate
Add this colorful template to your list and help hospitals present readmission and occupancy data. Here, you can show parameters such as appointments, dates, patient count, average treatment cost, admitted patients, readmission rate, bed occupancy rate, etc. With this ppt layout, you can reduce overcrowding and make sure all patients get timely care. Aslo, it can be very useful to create performance reports, staff briefings, strategy presentations, and board discussions.

Template 4: Real Estate Management System Dashboard With Occupancy Rate
Use the following template to explain the real estate management system. It can help your property owners, managers, and agents get an idea of how much space is being used and accordingly manage rent, leases and maintenance. It includes details related to property, date, net income, occupancy rate, talent acquisition cost, tenant turnover, revenue, and cost overview, loss due to vacancy, etc. The document can support better decision-making for renting, selling, or renovating. Now, click on the link and save it right away! It will keep landlords and property teams informed with real-time monitoring.

Template 5: Rental and Leasing KPI Dashboard Showing Rental Income Occupancy Tenants
A Rental and Leasing KPI Dashboard is a smart, effective tool that can track key property metrics like rental income, occupancy rate, and important tenant information. It can explain the late payments and inactive leases and support better forecasting decisions. So, include this simple template in your presentation template in your bundle and show all tenant details in one place. It can help you decide when to increase rent or offer discounts. Download the template now and make your leasing plan look professional and organized.

Template 6: Facilities Management Dashboard Highlighting Power Consumption and Occupancy Rate
With this colorful dashboard, you can learn about building energy use and space occupancy in one place. It can show live data on power consumption and occupancy rate and help reduce energy bills. You can use this attractive template and monitor levels of power consumed by machinery and display HVAC, occupancy rate, service requests and temperature. It can be a perfect document for audits, reviews, or even facility upgrade meetings. Also, you can help facility managers plan cleaning, maintenance, and staffing based on actual use and show complex building data to teams and top management.

Template 7: Dashboard Showing Occupancy and Vacancy Leveraging Effective CRM Tool in Real Estate Company
A Rental and Leasing KPI Dashboard is a smart, effective tool that can track key property metrics like rental income, occupancy rate, and important tenant information. It can explain the late payments and inactive leases and support better forecasting decisions. So, feel free to add the template to your presentation deck and show all tenant details in one place. It can help you learn about the current situation and you can decide when to increase rent or offer discounts. Download the template now and make your leasing plan look more reliable, and professional.

Template 8: Significance of a Powerful Dashboard Showing Occupancy and Vacancy Rates PPT Sample
Consider this attractive PPT template as an option to illustrate a dashboard showing- occupancy and vacancy rates. It shows an overview of how much space is being used or left empty in a building or facility. Here, you can also display property name, type, address, rental income, and other relevant details for better space scheduling. In this way, you can present building usage trends in a clean format and pitch smart space solutions to clients, investors, and your senior leaders. It can help you create smart planning reports and discuss space strategies during board meetings

Template 9: Rental and Leasing KPI Dashboard Showing Occupancy Cost Equity Loan to Value
A Rental and Leasing KPI Dashboard can guide property managers and investors to track financial performance and space use in real time. It gives a full picture of leasing efficiency, rental income, and property health so that you can make better decisions. So, include the following PowerPoint layout in your list and reduce risks and support better investment decisions. It shows data related to occupancy, equity, tenants, loans, and key financial parameters to identify revenue loss areas. Also, based on your business requirements, you can add important financial trends to the document and conduct proper audits, reviews, and client presentations.

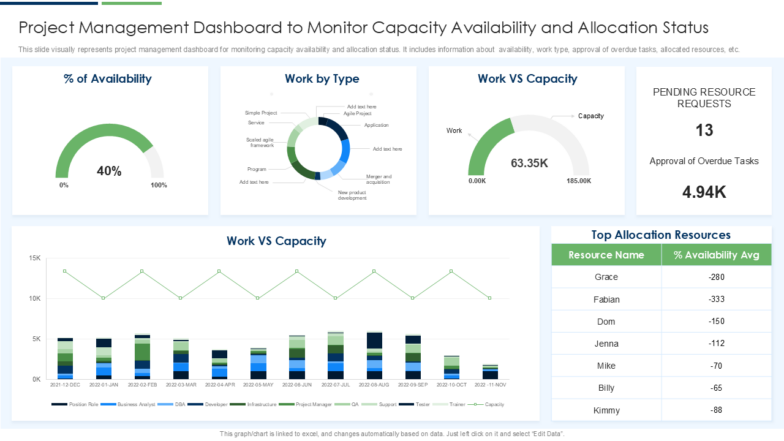
Template 10: Project Management Dashboard to Monitor Capacity Availability and Allocation Status
A Project Management Dashboard can display a clear picture of capacity availability and allocation status for different types of project operations. It can help project managers avoid overload, balance workloads, and plan future work with full confidence. You can use the following template and show real-time updates on team capacity, gaps in allocation, and other issues and limitations in a structured manner. It includes relevant details about availability, work type, approval of overdue tasks, allocated resources, etc. It can assist your team with better task planning, improve team efficiency, and make sure no one is overworked or underused.
Also, the document can identify unnecessary risks and project delays and help you manage different projects at the same time.
Conclusion
The Occupancy Dashboard is a smart project solution that can help you with live space tracking so that you know how your space is used. It tells you about daily occupancy, room usage, and peak hours so that you can plan better and improve capacity utilization. This approach will also save costs and help you make informed decisions about space management plans. And to make this concept more effective, enforce our structured templates and reap their benefits. They are designed to explain strategies, share reports, etc., during team briefings and pitch meetings. These documents will save your time, improve clarity, and bring everyone on the same page, perfect for workplace leaders and planners. So, get them now!
PS: Also, take a look at these hotel dashboard templates with samples and examples.
Occupancy Dashboard FAQs
1. Which KPIs should be tracked on an occupancy dashboard?
You can track different kinds of KPIs such as- occupancy rate, space utilization, daily occupancy, peak usage hours, and capacity vs. usage data. You can include desk booking rates, meeting room availability, and average space per employee for better results. Also, remember to check data for your daily foot traffic, desk booking success, room use patterns, and building efficiency. In this way, you can make sure resources are allocated efficiently across floors and departments.
2. How to monitor space utilization using an occupancy dashboard?
You can use dashboards that link with motion wifi tracking, sensors, badge data, etc, to monitor space utilization. They can easily collect live data and help you get an overall idea of the different occupancy trends, peak times, and underused spots. This approach not only better the efficiency of the entire process but can also reduce operational costs.
3. What tools are best for building an occupancy dashboard?
There are many smart tools that can help you create an occupancy dashboard and they are - Power BI, Tableau, SpaceIQ, Archibus, etc.
These smart tools can totally support real-time monitoring, floor plan visualization, and sensor integration. They can monitor occupancy trends and desk bookings as well. They can also integrate with existing workplace systems of your institution and improve facility management and resource use.