

Real Estate Management System Dashboard With Occupancy Rate





Try Before you Buy Download Free Sample Product
 Impress Your
 Audience
 100%
100% Editable
 Save Hours
 of Time


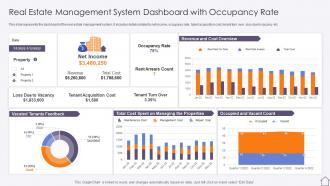
This slide represents the dashboard of the real estate management system. It includes details related to net income, occupancy rate, talent acquisition cost, tenant turn over, loss due to vacancy etc.
People who downloaded this PowerPoint presentation also viewed the following :
Real Estate Management System Dashboard With Occupancy Rate with all 7 slides:
Use our Real Estate Management System Dashboard With Occupancy Rate to effectively help you save your valuable time. They are readymade to fit into any presentation structure.





FAQs for Real Estate Management System Dashboard
Occupancy rates and rent collection percentages are your bread and butter - track those first. Also keep an eye on how long units sit empty between tenants. Maintenance costs per unit will save you from nightmare properties that eat your profits. I'd throw in tenant satisfaction too, even though it sounds touchy-feely, because happy tenants don't trash your place or skip out early. Cash flow by property is obvious but some people forget to actually track it separately. Oh, and rent-to-market ratios help you spot when you're leaving money on the table. Don't go overboard though - maybe 6 metrics tops or you'll never actually look at the data.
So basically these dashboards dump all your important stuff in one spot - occupancy rates, maintenance costs, rent collection, tenant satisfaction. No more drowning in spreadsheets, thank god. You can actually spot trends fast, like which properties are tanking or where you're hemorrhaging cash on repairs. Real-time data means you're not flying blind anymore. Honestly wish I'd discovered this sooner instead of tracking everything manually like a caveman. My advice? Figure out what's driving you crazy first, then find a dashboard that tackles those specific headaches.
Honestly? Start with Power BI if you're already using Microsoft stuff - it plays nice with Excel which most real estate people live in anyway. Tableau's another solid option for property data visualization. Google Data Studio surprised me lately, especially if your team's on Google Workspace already. Building custom with React/D3 gives you everything you want but man, that's a lot of work. Oh, and if you're doing property management, AppFolio and Buildium have okay reporting built-in, though you can't tweak much. I'd probably just go Power BI route first and see how it feels.
Dude, visualization is a game changer for real estate data. Like, scrolling through endless spreadsheet rows is torture - your brain picks up patterns way faster with charts and heat maps. I'm obsessed with using heat maps for portfolio overviews since you can see everything at once. Line graphs work perfectly for tracking rent trends over time. Honestly, don't try to visualize everything right away or you'll go crazy. Pick your most important metrics first and start there. Trust me, once you see vacancy rates displayed visually instead of just numbers, you'll never go back.
Real-time data is honestly everything for your dashboard. Without it, you're basically staring at fancy spreadsheets that tell you nothing useful. Track occupancy, rent payments, maintenance stuff - all as it happens. Otherwise you're managing properties with yesterday's info, which is brutal. Those live updates? They catch problems before they drain your wallet. Late payments, vacant units sitting too long, whatever. Oh and definitely get those automated feeds running first - I learned that one the hard way. You'll always be scrambling to catch up otherwise.
So basically dashboards let you see everything in one spot - all your tenant surveys, maintenance stuff, complaints, satisfaction scores. Really handy for spotting trends, like when satisfaction tanks after you raise rent (which always sucks but good to know). The visual setup makes it obvious which properties are problem children. You can even set alerts when scores drop too low. I'd probably check it way too often at first, but honestly the whole thing's useless unless you actually do something about what it's telling you. Faster repairs, better communication during renos - that kind of stuff.
Honestly, start with lease tracking and automated renewal alerts - that's your bread and butter. Payment tracking is huge too because chasing late rent manually will drive you insane. You'll want rent roll summaries and tenant contact management obviously. Oh, and make sure it flags lease expirations like 90 days early so you're not panicking trying to keep good tenants. Being able to generate lease docs right from the dashboard saves tons of time. Financial reporting that breaks everything down by property is pretty much non-negotiable. Digital storage for all your paperwork too - trust me on that one.
So basically you'd connect your dashboard to ML models that crunch all your historical property data - market trends, tenant behavior, that stuff. The models push predictions straight into your dashboard widgets. Maintenance forecasting, vacancy rates, future property values. You'll need APIs to grab external market data and link everything to your current property management system. Honestly, maintenance prediction is probably the best place to start since it's super practical. Then you can add more prediction types once you see how accurate things are. My buddy did this and said watching the predictions actually come true was kind of addictive lol.
Oh man, data integration is gonna be your biggest headache - getting rent rolls, maintenance stuff, and financial reports to actually talk to each other? Total mess. Your team will probably hate you at first for ditching their beloved spreadsheets lol. Don't overwhelm people with too many metrics right off the bat. Mobile access is crucial since property managers are always running around. Also, keeping everything accurate when you're pulling from like 5 different systems... yeah, good luck with that. Honestly though, nail down your most important data sources first and get everyone on board early or you're screwed.
Dude, get the mobile app if you don't have it yet. Game changer for handling stuff on the go. I approve maintenance requests while grabbing coffee, check occupancy rates during site visits - way better than being chained to your desk. When tenants text about water leaks or whatever, you can dispatch someone instantly instead of finding out hours later when it's already a mess. Response times get so much faster. Honestly saved my butt multiple times when small issues could've turned expensive. Your tenants will definitely notice the difference too.
Start with your property management system for rent rolls and maintenance stuff - that's the obvious one. QuickBooks handles your cash flow tracking pretty well. For market comps, Zillow or CoStar data helps with pricing (though CoStar's pricey if you're just starting out). IoT sensors give you real-time occupancy and energy usage, which is honestly cooler than it sounds. Tenant apps can track satisfaction scores too. I'd pick maybe 2-3 sources that fix your biggest headaches first. You can always add more later once you've got the basics humming.
So basically, these dashboards dump all your property finances in one spot - rent collection, maintenance costs, vacancy rates, the whole mess. Way better than hunting through random spreadsheets every month. The cool part is the forecasting stuff actually works pretty well once you feed it enough data. It'll predict your cash flow and help you budget for repairs before they blindside you. I'd say track your main numbers for like 3-4 months first, then you'll have decent trends to work with. Honestly makes the whole financial side way less of a headache.
Focus on occupancy rates, NOI, and cash flow first - those three tell you if you're actually making money. Maintenance costs per unit matter too because they can destroy your margins if you're not careful. I always track tenant turnover since finding new renters is expensive and annoying. Rent per square foot helps when you're comparing different properties. Look, you could track like 15 different things but honestly? These basics will show you what's working and what isn't. Set up some kind of alert system so you'll know right away if numbers start dropping.
Honestly, customization is a game changer because people can actually focus on their stuff instead of scrolling through random widgets they don't need. Let them move things around, pick which metrics show up first, set alerts for lease renewals or whatever. Property managers are all different - some live and breathe occupancy rates, others just want to see cash flow (which makes sense tbh). If someone can set up their dashboard to match how they actually work, they'll open it every day instead of dreading it. Figure out what your users do most and make those things super flexible.
Start with role-based permissions - you don't want your maintenance guy seeing tenant financial stuff, right? Multi-factor auth is a must when you're handling people's bank info and personal records. Encrypt everything, both when it's moving around and sitting in your database. Also set up audit logs so you can see who looked at what data and when - super important for compliance headaches later. IP whitelisting works great if your team always works from the same spots, but honestly that's getting less common these days. Get the basics locked down first.
-
“Slides are formally built and the color theme is also very exciting. This went perfectly with my needs and saved a good amount of time.”
-
Commendable slides with attractive designs. Extremely pleased with the fact that they are easy to modify. Great work!