


 0 Comment
 Customer Reviews

Ever get the feeling that your sales pipeline looks more like a giant black hole than a clear passage to revenue? You’re not alone. For many businesses, especially today in an incredibly competitive market, tracking leads, converting prospects, and identifying bottlenecks are important but making it happen is not easy! That’s where Pipeline Dashboards offer better, cleaner forecasts and a better, more confident sales process.
HubSpot, Salesforce, Zoho, and Pipedrive are some of the big names that have come a long way using pipeline dashboards and doubling their use then before. Why ? Because tracking and visualizing the flow of prospects through every stage of the funnel is not an option, but a requirement. Yet, many sales teams are still flying blind using cumbersome spreadsheets, ungainly reports, or stale views of the CRM. And obviously leading to targets missed, pipelines are choked with space junk (dead leads).
Get to our blog on Top 10 Sales Pipeline Dashboard Templates to bring relevant customers in the sales pipeline .
So what’s getting teams stuck? It’s rarely the intent, but how to get started. Whether deciding which KPIs to choose, to putting together an actual functional layout, actually launching a dashboard that works can feel like solving a Rubik’s cube while blindfolded.
Here is where SlideTeam’s “Top 10 Pipeline Dashboard Templates comes in to save the day. Our high end frameworks decrease the complexity, to track what matters! You get everything from CRM dashboard, KPI dashboard trends, sales funnel visibility, better reporting tools and much more!
You can’t skip the best part! Every template is 100% editable, content ready, easy to use, and available for download in high-resolution PNG and JPG formats to get you started.
Without waiting! Scroll through our blog and see what you get in each template and how they will turn your sales strategy from clunky to clear!
Don't miss our blog on Top 10 Pipeline Review Templates to track and enhance sales strategies, monitor leads, identify bottlenecks, and ensure steady progress.
Template 1: Sales Pipeline Management Dashboard for Business PPT Template
This presentation slide holistic view of the sales process for your entire team which allows them to keep sales tracking progress and performance. It shows you key figures including revenue, target achievement, and impact of closed deals. Further covers target numbers with regional targets, and list of rationale for rejecting targets. It helps to assess pipeline health, realign strategies, and enhance the accuracy of their forecasts. Get it now.

Template 2: Sales Campaign Pipeline Management Dashboard PPT Template
This PPT Theme presents the best-performing campaigns sales pipeline, revenue projections per marketing channel and the number of new leads acquired this month. Lead status by the owner helps managers delegate responsibilities. It highlights the precise areas in targeting or messaging that require focus. It also encompasses campaign types and total deals amount giving visibility on ROI and sales potential. It helps you align your campaign strategies with reality. Download now.

Template 3: Sales Pipeline Management Dashboard for Different Stages PPT Template
This PPT Theme provides an overview of performance at each sales pipeline management stage. HTR tracks crucial metrics such as budget, target, and actual sales, enabling teams to monitor progress in real time. It has sold versus budget, open sales by stage and the top deals that are going to close in the upcoming days. Sales managers can catch performance shortfalls early by comparing activities against targets. Claim it now.

Template 4: Sales Pipeline Management Dashboard Showing Sales Pipeline Opportunities PPT Template
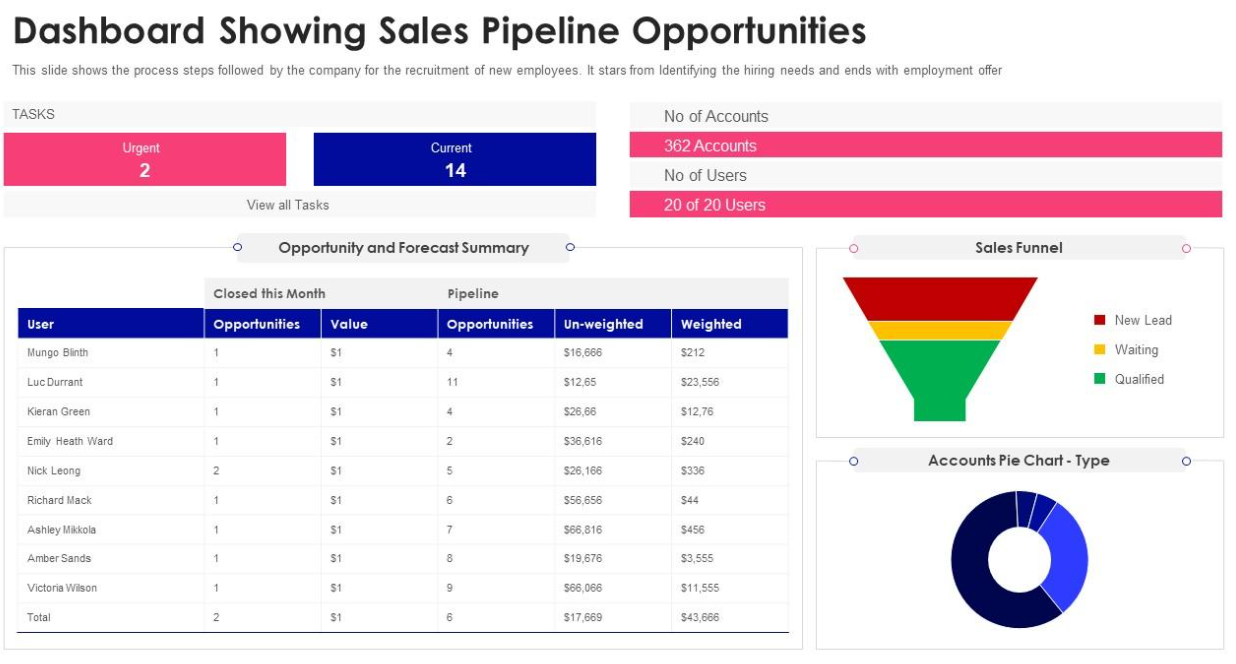
This PPT Template offers perspective of all the active sales project pipeline opportunities in one place. It focuses on the key pipeline stages like qualification, proposal, negotiation, and close for businesses to monitor the deal progress effectively. It allows teams to determine which opportunities require intervention, evaluate expected revenue. By organizing data through sales stages, they empower users to expedite pipeline health assessments and remedy deal stagnation. Get it now.
Template 5: Sales Pipeline Management Pipeline Management Dashboard PPT Template
This presentation theme visualizes all steps of your sales process including qualified, proposal, negotiation, won, and lost opportunities, to help you quickly equip imbalance in deal flow and conversion. This dashboard analytics brings forward new possibilities and provide a clear breakdown of top ten revenue contributing customers. It empowers businesses to directly focus on high-value relationships and quickly identify the areas by tracking these details. Download now.

Template 6: Daily Sales Pipeline Management Dashboard PPT Template
This presentation theme offers an overview of lead scoring activity and engagement. It covers important metrics like daily leads that have been added to your database, the active leads, and the leads that have engaged within the last 30 days. This makes it easier for sales teams to determine which follow-up should take priority, monitor ongoing interactions, and identify dormant opportunities. Get it now to fortify lead closing.

Template 7: Track Big Data Platform Dashboard for Pipeline Monitoring PPT Template
This PPT Framework monitors data dissemination across numerous endpoints, in a clear way. It comprises vital performance metrics (data endpoint, task executor, system health, and server class) helping the teams to evaluate the performance of the infrastructure. It allows for real-time monitoring of pipeline activity, provides transparency into number of servers and descriptions of data, ensuring nothing falls through the cracks. Download it now.

Template 8: Sales Closing Dashboard for Pipeline Management PPT Template
This PPT Theme assists sales managers in tracking and realising the deal closure operations. It covers metrics like quarterly and monthly sales closing, average deal age , deals by segment This data allows teams to evaluate the pipeline stages, find aging opportunities, and segment by the highest value. The dashboard provides data insights facilitating more accurate forecasting and early identification of bottlenecks. Claim it now to align team efforts.

Template 9: Dashboard Showing Effective Management of Sales Pipeline Sales Pipeline Management Strategies
This PPT Template demonstrates a high-level overview of sales performance, efforts of the team and forecast planning. It brings together key metrics, like closed business, sales pipeline and month-over-month growth to provide decision-makers with real-time pipeline health. It helps optimize the full sales cycle while staffing also reflects anticipated growth. It helps in reliable data backing up while keeping your team in sync with strategic goals. Get now.

Template 10: Hiring Dashboard for Company with Candidate Pipeline PPT Template
This presentation framework involves with metrics such as the number of active candidates, inactive profiles, registered applicants, CVs sent, interviews scheduled, and final placements. Hiring managers can use the dashboard to break candidates down by salary range, permanent and temporary, to ensure offers align with the market. Utilize this business intelligence dashboard to manage your recruitment pipeline and make better talent decisions. Download it now.

Filter Your Workflow And Make Closing Deals Faster!
A pipeline dashboard is not merely a wall hanging waiting to be noticed — it is the power center of intelligence about sales/project management decision making. From lead management, project stage tracking, sales forecasting, data Visualization and more our pipeline dashboard gives you a complete visibility of how things work. It shows you what resonates, where deals are stalling, and which actions should be prioritized—so your team can respond accordingly.
SlideTeam believes that a good representation of data is the first step towards better solutions. Our Top 10 Pipeline Dashboard Templates make sure deliveries are met on time & with quality used across industries in tech, consulting, real estate, healthcare, manufacturing and more! Our frameworks turn separate data into real-time actionable insights to improve accountability, collaboration and pricing conversion rates.
Grab our template today, and gain total control on your workflow — because when your pipeline is clear, the path to success is all the more clearer.
PS: Look out our blog on Must-Have Pipeline Proposal Templates to convey ideas, strategies, and solutions to potential clients, investors, or stakeholders.
Pipeline Dashboard FAQs
What is a pipeline dashboard in sales or project management?
A pipeline dashboard is a visual tool that gives you insights into the state, progress, and key metrics for your sales or project pipelines. In sales, it lives on through deals progressing through the stages of the sales process. In project management, it represents tasks or projects as they flow through various phases, such as planning, execution, completion, etc. It centralizes a view, which helps teams in monitoring the performance, which allows them in making choices based on data.
How does a pipeline dashboard help track sales performance?
An overview of ongoing sales performance pipeline dashboards offer visibility into deals across the pipeline, including deal stages, conversion rates, revenue forecasts, or even individual/team performances. Spotlight pain points, discover top-priority opportunities, and confirm that your sales reps are engaging with the right leads.
What are the key features of an effective pipeline dashboard?
Features of an Effective Pipeline Dashboard. Your pipeline dashboard should have:
Instant updates to show the state of pipeline today
Filters that can be modified (for example, unpaid, area, merchandise, etc.
Graphs and Analyses in a Visual Form (e.g. funnel charts, bar graphs)
Deals or Tasks with breakdowns per stage
Stats like win ratio, deal size, close rate etc.
Tips or color coding for all stalled or at risk items
Feature to integrate with CRM or project management tools
All of it aids alignment, rapid action, and efficiency for teams.