


Business heatmap analysis





Try Before you Buy Download Free Sample Product
 Impress Your
Audience
 100%
Editable
 Save Hours
of Time


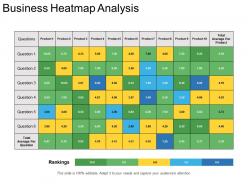
Exercise due care before arriving at decisions with our Business Heatmap Analysis. It allows you to be circumspect.
People who downloaded this PowerPoint presentation also viewed the following :
Business heatmap analysis with all 5 slides:
Our Business Heatmap Analysis are invariable attractive. Folks find them inherently inspiring.


FAQs for
Dude, heatmaps are honestly a lifesaver when you've got tons of data to make sense of. Perfect for correlation matrices - you can instantly see which variables actually relate to each other. Website stuff too, like tracking where people click or how long they hang out on different pages. Geographic data works great - population density, regional sales, that kind of thing. Oh, and time-series data! Seasonal patterns pop right out. Way better than scrolling through endless Excel sheets (ugh). Just don't go crazy with the colors - pick something that won't make your audience's eyes bleed.
Dude, heatmaps are seriously a game-changer. They show you where people actually click and scroll on your site - not where you think they do. I've seen so many websites with CTAs that literally nobody touches. You'll spot the dead zones instantly, plus figure out why people bail on certain pages. Way better than just staring at boring analytics numbers, honestly. Oh, and don't overthink it - just start with your busiest pages first. Look for the obvious stuff where users seem confused or stuck. It's like finally understanding what's been broken this whole time.
Honestly, heatmaps are perfect when you've got massive datasets or need to show relationships between two variables. Bar charts would be a disaster for that stuff. I use them all the time for correlation matrices or tracking website clicks - way better than having like 50 overlapping lines that look ridiculous. They work great for geographic data too, where color intensity says more than actual numbers would. Your audience can spot trends and weird outliers super fast. Just don't make your color scale confusing - I've seen people use red for "good" which throws everyone off.
Depends what you're working with! Python's got Matplotlib, Seaborn, and Plotly - Seaborn's my go-to since it makes gorgeous heatmaps without much hassle. R people love ggplot2 and pheatmap (never used R myself though). Not a coder? Tableau works great, Excel's okay for basic stuff. Oh, and if you meant website heatmaps, Hotjar's really good for seeing where users click. Honestly I'd just stick with whatever you already know how to use. Most tools can pull off decent heatmaps once you mess around with them a bit.
Dude, heatmaps are basically like spying on your users - you can see exactly where they click, scroll, and hover around your site. Click maps show which buttons people actually use (spoiler: probably not the ones you think). Scroll maps tell you if anyone's reading past the fold or just bouncing immediately. Hot spots show up in red and orange, so it's super obvious what's getting ignored. I got way too into analyzing mine last week - it's weirdly fascinating! Just move your important stuff to wherever people are naturally looking and fix the dead zones.
Honestly, heatmaps are perfect for stuff like correlation matrices or when you've got time-series data with clear patterns. Geographic data works great too - anything where you're comparing metrics across two dimensions. I use them all the time for density visualization, like website clicks or survey responses. Way better than staring at endless spreadsheet rows! Just make sure your data actually has meaningful relationships between the rows and columns. Random numbers won't tell you much. Oh, and always ask yourself what pattern you're trying to show first - saves you time later.
Your gradient choice can totally make or break a heatmap. Rainbow gradients are the worst offenders - they look cool but our brains can't process those color jumps consistently. For sequential data, skip red-to-green and go with something like viridis or ColorBrewer palettes instead. They're designed so your eye reads the transitions more naturally. Oh, and definitely check how it looks for colorblind people too. I learned that one the hard way when my boss couldn't read half my charts. Trust me, picking the right colors isn't just about aesthetics - it's about whether people actually understand your data.
Yeah, you totally can! Connect your heatmap to streaming data through APIs or WebSockets - libraries like Leaflet and D3.js handle live updates pretty well. Just push fresh data every few seconds or minutes, whatever works for your situation. I've seen this done really well for tracking website clicks, IoT sensors, live traffic stuff. Oh, and definitely test your refresh rate first - nobody wants to be the person who crashes everyone's browser because you're updating too aggressively. But honestly, real-time heatmaps look pretty impressive when done right.
Pick a color scheme that makes sense - cool colors for low values, warm for high ones. Don't overcomplicate it with tons of gradients because people just get lost. Position your legend somewhere it won't cover up the good stuff. Make your value ranges logical and evenly spaced. Honestly, I've seen so many heatmaps where the bins are all wonky and nobody can figure out what's going on. Keep it simple enough that someone can look at it for like two seconds and get the pattern. Run it by someone else first - if they're confused, you'll know to dial it back.
Honestly, there are tons of ways to mix heatmaps with other charts. Scatter plots work really well - you get the density view plus individual data points. Small multiples are clutch for comparing categories side by side. I'm kinda obsessed with pairing them in dashboards alongside bar charts or line graphs, gives you the full picture. Oh, and making heatmaps interactive is pretty slick - click a cell and watch other charts update. The trick is figuring out what story you're missing from just the heat patterns alone, then find charts that fill those gaps.
Watch out for outliers - they'll mess up your whole color scale and make everything else look boring. Color choices are huge too since colorblind people might completely miss your patterns (learned this the hard way once). Your bin sizes totally change what shows up, so don't trust the first version you make. I'd check your raw data distribution first, then try different color schemes. Maybe create a couple different views of the same data? One heatmap rarely tells the complete story anyway.
So marketing teams use heatmaps to track where people click and scroll on websites - shows what actually catches attention vs what gets totally ignored. Healthcare does something completely different though. They'll use them for tracking patient data patterns or infection spreads in hospitals. Pretty cool how the same tool works across industries, right? If you're doing marketing stuff, definitely try website heatmaps first - they're great for fixing landing pages. For other fields, just think about any data you've got with location or intensity angles. That's where heatmaps really shine.
Dude, heatmaps are like having x-ray vision for your A/B tests. Your conversion data tells you which version won, but heatmaps show you the actual story - where people clicked, how far they scrolled, what they totally ignored. I've seen so many tests where the "winning" CTA was basically invisible to users, which is... awkward. The cool part is layering them together. You'll spot patterns you'd never catch just looking at numbers. Like maybe people love your new button but hate where you put it? Super useful combo for figuring out what actually moves the needle.
Honestly, geographic heatmaps are like having x-ray vision for city planning. You can layer stuff like population density, crime stats, or traffic flow and boom - problem areas just jump out at you. Perfect for deciding where to stick new schools or bus stops. I've seen planners use them to find literal heat islands that desperately need more trees. Way better than trying to explain spreadsheet data to a room full of city council members who probably stopped listening after row three. Oh, and they're great for spotting service gaps too. I'd say pick one metric first and see what patterns emerge.
Honestly, people think heatmaps are like mind-reading tools - they're not. They just show clicks and scrolling patterns. Those bright red spots everyone gets excited about? Sometimes they actually mean users are confused and clicking everywhere trying to find something. Oh, and you don't need thousands of users to spot problems - way fewer than most people assume. I learned this the hard way on a project last year. The real trick is mixing heatmaps with other stuff like session recordings. Don't make design choices based on heatmaps alone - that's asking for trouble.
-
Great experience, I would definitely use your services further.
-
Content of slide is easy to understand and edit.