


Business operational processes powerpoint presentation slides





Try Before you Buy Download Free Sample Product
 Impress Your
 Audience
 100%
100% Editable
 Save Hours
 of Time


Looking for a stunning sample of PPT presentation to leave a lasting impression with your next business operational processes PowerPoint presentation? Here's a one! Well coming to uses, than you can apply this presentation deck to explain ins and outs of company's business processes for better management and improvement. In addition, our PowerPoint show also supports to address business challenges and identify bottlenecks for laying emphasis on operational improvement. Furthermore, with help of our PPT model you can give a symbolic message to your workforce for better alignment of company operations with business strategy. In short, a readymade deck helping to increase control and consistency for efficient operations management. Most exciting thing here is that exclusive PowerPoint templates like changes in competitive environment, money raised so far, key performance indicators, financial base plan, new customer acquisition cost, gross margin improvement etc. are included giving edge to presenter for total quality management. In nutshell, this is a complete business process PPT sample file. The only thing that is left now is to get started by downloading immediately. Create the impression you intended with our Business Operational Processes Complete Powerpoint Deck With Slides. Convey your brainwave exactly as you had imagined.
People who downloaded this PowerPoint presentation also viewed the following :
Content of this Powerpoint Presentation
Slide 1: This slide introduces Business Operational Processes. State company name here.
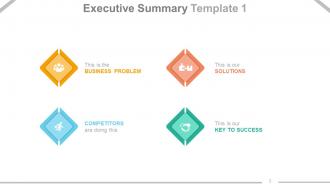
Slide 2: This is an Executive Summary slide showcasing BUSINESS PROBLEM, SOLUTIONS, COMPETITORS, KEY TO SUCCESS.
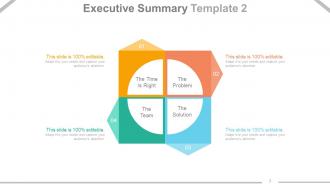
Slide 3: This is another Executive Summary slide stating- The Problem, The Solution, The Team, The Time Is Right.
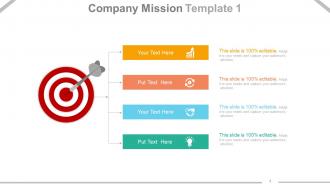
Slide 4: This slide states Company Mission with text boxes, target and arrow imagery.
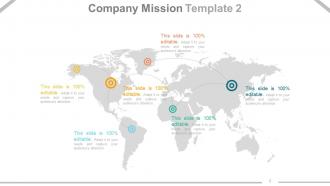
Slide 5: This slide also presents Company Mission in a world map image form.
Slide 6: This slide also presents Company Mission with creative imagery.
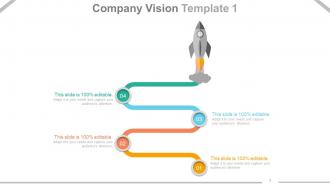
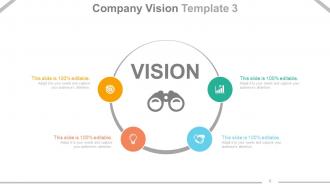
Slide 7: This slide states Company Vision with text boxes and imagery. State mission, vision etc. here.
Slide 8: This slide also states Company Mission with respective icons and arrow imagery.
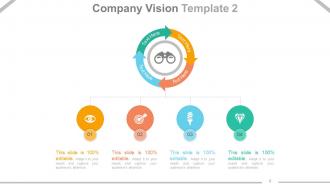
Slide 9: This slide also states Company Vision. State it here.
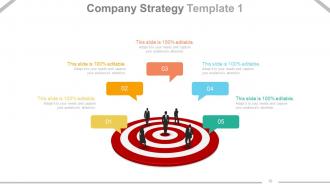
Slide 10: This slide showcases Company Strategy in people silhouettes and target imagery to go with.
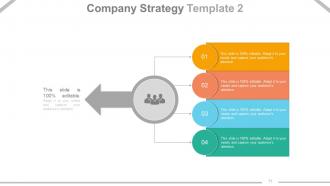
Slide 11: This slide also states the Company Strategy.
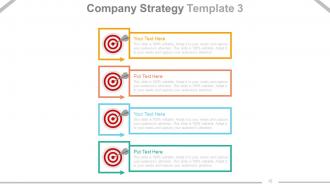
Slide 12: This slide also states Company Strategy with arrow and target imagery.
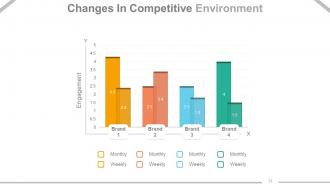
Slide 13: This slide showcases Changes In Competitive Environment in a bar graph form.
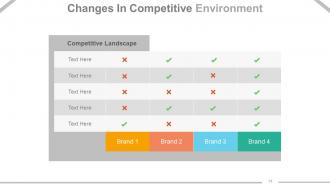
Slide 14: This slide also showcases the Changes In Competitive Environment in a tabular form.
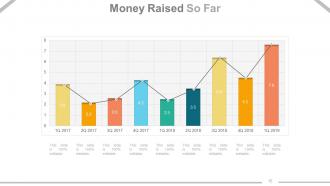
Slide 15: This slide displays Money Raised So Far in a bar graph form.
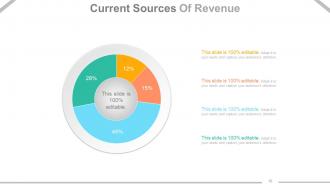
Slide 16: This slide displays Current Sources Of Revenue in a pie chart form.
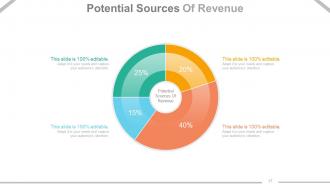
Slide 17: This slide displays Potential Sources Of Revenue in a pie chart image form.
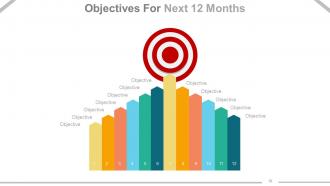
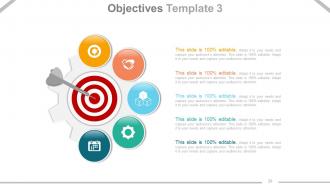
Slide 18: This is Objectives For Next 12 Months slide with target imagery. State your objectives etc. here.
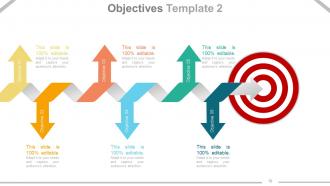
Slide 19: This slide also states Objectives of the company.
Slide 20: This slide also shows Objectives with icons and imagery.
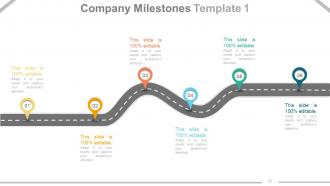
Slide 21: This slide showcases Company Milestones in a timeline form.
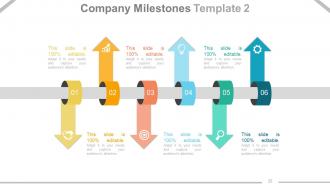
Slide 22: This slide also states Company Milestones with arrow imagery.
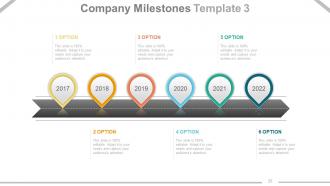
Slide 23: This is another slide showcasing Company Milestones.
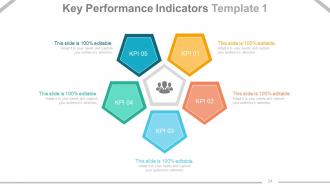
Slide 24: This slide presents Key Performance Indicators with text boxes to state.
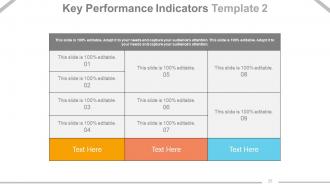
Slide 25: This slide also presents Key Performance Indicators. State them here.
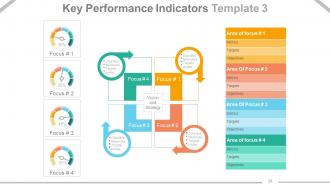
Slide 26: This is another slide showing Key Performance Indicators in charts and graphs.
Slide 27: This slide displays Financials Summary: Base Plan Vs Stretch Plan.
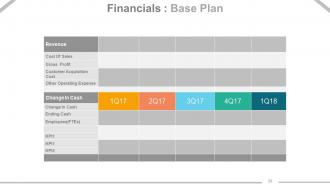
Slide 28: This slide states Financials : Base Plan with Revenue and Change in Cash as its sub headings.
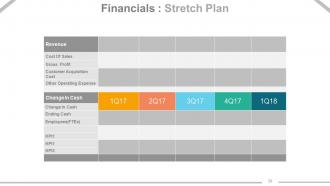
Slide 29: This slide also shows Financials : Stretch Plan.
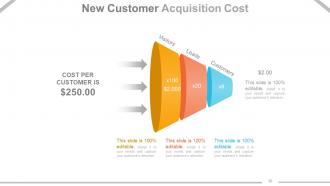
Slide 30: This slide displays New Customer Acquisition Cost in a funnel form. It includes- Visitors, Leads, Customers.
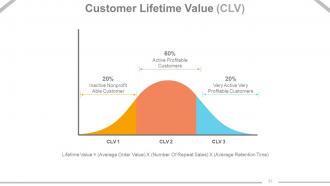
Slide 31: This slide showcases Customer Lifetime Value (CLV) in a curve diagram form.
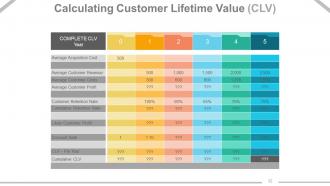
Slide 32: This is Calculating Customer Lifetime Value (CLV) slide in a tabular form.
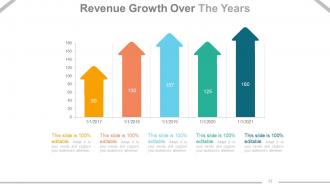
Slide 33: This slide displays Revenue Growth Over The Years with arrow imagery.
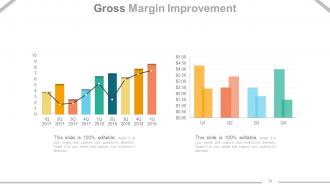
Slide 34: This slide displays Gross Margin Improvement in charts and graphs image form.
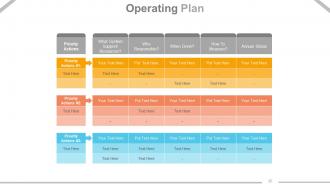
Slide 35: This slide showcases Operating Plan with the following sub headings- Priority Actions, What System Support/ Resources? Who Responsible? When Done? How To Measure? Annual Status.
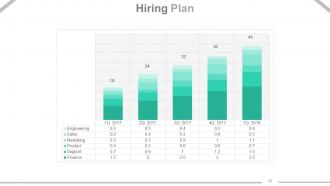
Slide 36: This slide showcases Hiring Plan in a bar graph/ chart form.
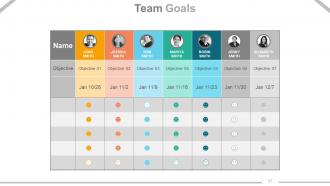
Slide 37: This slide states the Team Goals with name, designation etc.
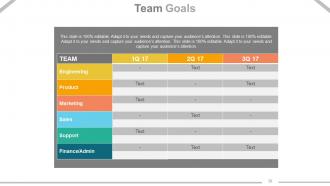
Slide 38: This slide also shows Team Goals.
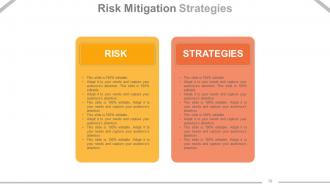
Slide 39: This slide showcases Risk Mitigation Strategies in terms of Risk and Strategies.
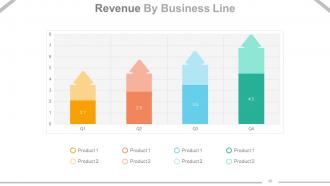
Slide 40: This slide showcases Revenue By Business Line.
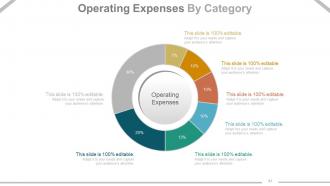
Slide 41: This slide showcases Operating Expenses By Category in a pie chart form.
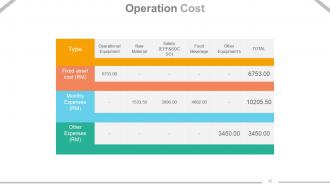
Slide 42: This slide presents the Operation Cost.
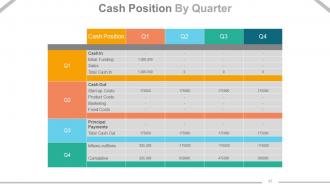
Slide 43: This slide showcases Cash Position By Quarter. Change/alter contents as per need.
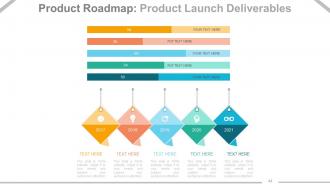
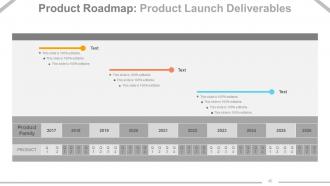
Slide 44: This is a Product Roadmap: Product Launch Deliverables slide with text boxes.
Slide 45: This slide also presents Product Roadmap: Product Launch Deliverables.
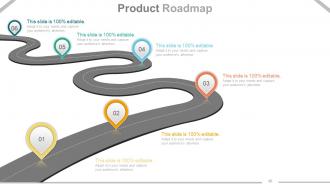
Slide 46: This is another slide displaying Product Roadmap to state product growth, comparison etc.
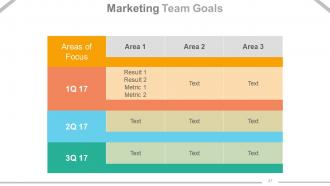
Slide 47: This slide states Marketing Team Goals with Area Of Focus.
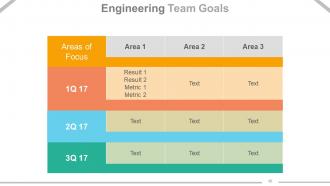
Slide 48: This slide states Engineering Team Goals. You can add/ change text as per need.
Slide 49: This slide is titled Additional slides to proceed forward. You can change/ alter the contents as per need.
Slide 50: This is a Quotes slide to convey message, beliefs etc.
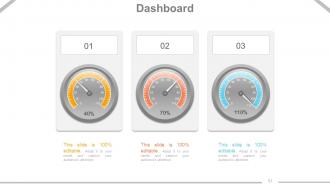
Slide 51: This is a Dashboard slide to state metrics, kpis etc.
Slide 52: This is a Thank You slide with Address# street number, city, state, Contact Numbers, Email Address.
Business operational processes powerpoint presentation slides with all 52 slides:
Give folks an insight with our Business Operational Processes Complete Powerpoint Deck With Slides. Enable folks to figure out the conditions.



FAQs for Business operational processes
You'll need four main things: process optimization, resource allocation, tech integration, and performance tracking. Honestly, start by mapping your workflows - I guarantee you'll find inefficiencies you didn't know existed. It's kind of wild how much stuff we just accept as "normal." Next, align your people and budget with what actually matters for your goals. Make sure your data systems can talk to each other (this one's huge). Good KPIs help too. The trick is staying efficient while keeping room to grow. Pick one core process and audit it this week - don't overthink it.
Start with the boring stuff - automate invoicing, scheduling, data entry. Map out what you're doing now and you'll probably find tons of wasted steps. Honestly, some companies have like 5-person approval chains for ordering office supplies! Get your team involved since they know where things actually suck. Pick one workflow to standardize first, then measure how much time you saved. Oh and don't buy a bunch of random tools that don't talk to each other - that'll just create more headaches. Once you nail one process, you can expand from there.
Look, tech runs everything now. It handles the boring stuff automatically and gives you actual data to work with instead of guessing. Cloud stuff manages your systems, AI optimizes workflows, dashboards show what's happening. Your customers want everything digital too - online orders, chat support, the works. I mean, going back to doing everything in Excel sounds like torture honestly. The trick is choosing tools that fix your actual problems. Don't just chase whatever's trending - half that stuff is overhyped anyway.
Honestly, start with just 3-5 metrics that actually move the needle for your business. I'd focus on cycle time, error rates, customer satisfaction, and cost per transaction - stuff that tells you if you're both fast AND good. Don't get sucked into vanity metrics that look impressive but mean nothing. Monthly reviews work for most teams, though quarterly's fine too if you're not moving super fast. The real trick is balancing efficiency with quality - no point being lightning quick if you're screwing things up. Once you nail those basics, then you can get fancier with tracking.
Ugh, where do I even start? Supply chain's still a mess, finding good people is brutal, and managing remote teams feels impossible some days. Cash flow's tighter with everything costing more - materials, wages, you name it. Plus there's always some new regulation to figure out, which honestly drives me crazy. Digital stuff is huge too but it's hard when you're just trying to keep the lights on, you know? My advice? Focus on whatever's hitting your bottom line hardest first. Don't try fixing everything - you'll burn out fast.
LED bulbs are honestly a game-changer for ROI, so start there along with basic recycling programs. Cut down on paper waste too. Remote work policies will slash commuting emissions - plus your employees will love you for it. When picking suppliers, go with companies that actually care about sustainability (not just the ones with fancy green logos). If you're manufacturing stuff, audit those processes for waste. Oh and digital storage beats physical servers for energy use. Pick one thing first, see how it goes, then expand from there. Don't try to do everything at once or you'll burn out.
Look, your supply chain literally controls whether you make money or not. Bad management means you're dealing with stockouts, too much inventory sitting around, late shipments - basically everything that pisses off customers. But when you nail it? Companies see 10-15% profit boosts just from cleaning up their processes. You'll get faster deliveries, better vendor deals, smarter inventory control. Honestly, mapping out what you're doing now is the best first step - find where things are getting stuck and fix those bottlenecks first.
Dude, operational risks can totally wreck your business if you're not careful. Supply chain issues, systems crashing, people quitting without notice - it all hits your cash flow and makes customers lose faith in you. Honestly, most businesses wait until something breaks before they even think about this stuff. Map out your biggest vulnerabilities first. Cross-train your team so you're not screwed if someone leaves. Get backup suppliers, invest in decent tech that won't die on you randomly. Build some actual contingency plans too. Pick your top 5 risks and just focus on fixing the worst one this quarter.
Honestly, focus on three things: how you communicate, who owns what, and keeping people connected. Daily standups are clutch for staying aligned - just don't go overboard with meetings or everyone will hate you. Be super clear about deadlines and responsibilities because remote work falls apart when people don't know what they're supposed to do. The culture piece is trickier. Virtual coffee breaks sound cheesy but they actually work. Celebrate wins publicly in your team channels too. You'll need solid tools - Slack for chat, something like Asana for projects, maybe shared dashboards. Start by figuring out where your communication is broken right now and fix that mess first.
Honestly, spreadsheets will only get you so far - data analytics actually shows you patterns you'd miss otherwise. You'll catch bottlenecks way earlier and predict demand without just crossing your fingers. The cool part? You can run different scenarios before spending any money, which beats making decisions based on hunches at 2am. I'd say start with just one metric that's bugging you most. Once you see how it helps with resource planning and stops small issues from becoming expensive headaches, you'll probably want to expand it.
Honestly, business operations are getting turned upside down right now. AI's handling all the boring stuff - feels weird but your team can focus on bigger picture things. Supply chains went local after everything got screwed up the past few years. Remote work means you gotta digitize basically everything (which is probably overdue anyway). Customers won't shut up about sustainability now, so that's not optional anymore. The game changer though? Getting data instantly instead of waiting forever for some report. I'd start by figuring out what repetitive tasks you could automate first.
Honestly, getting departments to actually talk to each other is a game changer. Those silos are the worst - they slow everything down and create so much duplicate work. Regular check-ins between teams help catch issues early, and you'd be surprised how often marketing spots something ops totally missed. Finance always has those cost-saving ideas that make engineers go "why didn't we think of that?" Don't just hope it'll happen naturally though. Weekly cross-functional meetings are clutch for building the habit. When everyone's actually aligned, decisions happen way faster and the solutions are usually better too.
Okay so quality control - start by writing down what "good" actually looks like for your processes. Everyone needs to know the standards. Do regular checks and audits (seriously, companies that skip this always pay for it later). Train your people well and make sure problems get flagged fast. If you're doing anything complex, maybe look into ISO standards or similar systems. Oh and here's the thing - quality can't just be one department's job. Everyone has to care about it or it won't work. Pick one process first and nail that down before expanding.
Map out what you're doing now and hunt for the seven wastes - overproduction, waiting, transport, over-processing, inventory, motion, defects. Value stream mapping shows you exactly where things get stuck. Honestly, 5S is clutch for getting workspaces organized and standardized. Get your team doing kaizen - those small tweaks they suggest beat waiting around for massive changes. Oh, and don't try to fix everything at once. Pick one process, nail it, then move on. You'll actually see progress that way instead of spinning your wheels.
Look, continuous improvement just means you're always tweaking stuff to make it work better - processes, products, whatever's bugging your team. Everyone stays on the lookout for faster, cheaper, or higher quality ways to do things. Honestly, it sounds like a lot of work but teams actually get energized once they're in the groove. The real win? You spot problems before they blow up in your face. Plus you don't get stuck in that "good enough" trap while competitors zoom past you. My advice - start stupid small. Pick one thing your team constantly gripes about and spend half an hour just throwing around ideas.
-
Thank you for the professional presentations
-
The Designed Graphic are very professional and classic.
-
Thanks for all your great templates they have saved me lots of time and accelerate my presentations. Great product, keep them up!