


11739184 style hierarchy flowchart 1 piece powerpoint presentation diagram infographic slide




Try Before you Buy Download Free Sample Product
 Impress Your
 Audience
 100%
100% Editable
 Save Hours
 of Time


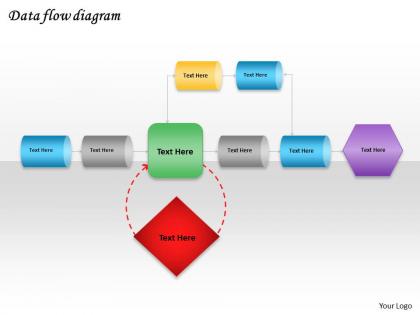
Want to create impressive slides for your PowerPoint presentation to approach the target audiences than our data flow PowerPoint template slide will give an instant solution to all your needs. This PPT slide diagram contains unique slide designs that you can download to decorate your presentations with professional multi-level diagrams. You can use this core PowerPoint template to prepare presentations on business strategy and taking decisions. Also this amazing slide can be used in all kinds of presentations where the process involved and can be well defined through the stages such as business planning, business management, risk management, decision making model, and many more like these. This PPT graphics helps to develop the brainstorming and scientific attitude approach towards the target audiences to deal well with the barriers or problems. Our PowerPoint template is quite useful to present the various concepts of business and its strategies in a different and more alluring ways which helps in better understanding and more easy approach to achieve the targets or goals. Do you have it in you? Display it with our Data Flow Powerpoint Template Slide.
11739184 style hierarchy flowchart 1 piece powerpoint presentation diagram infographic slide with all 5 slides:
Our Data Flow Powerpoint Template Slide will glue it together. Your thoughts will adhere to your direction.
FAQs for 11739184 style hierarchy flowchart 1 piece powerpoint presentation
Data flow diagrams include processes, data stores, external entities, and data flows as their fundamental components. These elements work together to visualize system operations by showing how information moves between different parts, where data gets stored temporarily or permanently, and how external users interact with the system, ultimately enabling organizations to streamline workflows and enhance operational efficiency.
DFDs focus specifically on data movement and transformation within systems, while flowcharts emphasize sequential process steps and decision points. DFDs use standardized symbols like circles for processes and arrows for data flows, enabling organizations to visualize information pathways more clearly than traditional flowcharts, ultimately delivering better system analysis and streamlined data architecture planning.
Data flow diagrams include context diagrams (Level 0), overview diagrams (Level 1), and detailed process diagrams (Level 2 and beyond), each providing increasingly granular system views. These hierarchical levels enable organizations to streamline system analysis by starting with broad organizational processes, then drilling down into specific workflows, ultimately delivering enhanced documentation clarity and more efficient system development across industries like banking and healthcare.
External entities in a DFD represent sources and destinations of data that exist outside the system boundary, including customers, suppliers, regulatory bodies, and other systems. These entities define system scope by showing where data originates and terminates, with many organizations finding that clearly mapped external entities streamline requirements gathering, enhance stakeholder communication, and ultimately deliver better system integration and more accurate business process documentation.
DFDs help in system analysis and design by visualizing data movement, identifying system boundaries, and revealing process interdependencies throughout an organization's workflow. They enable analysts to streamline requirements gathering, enhance communication between stakeholders and developers, and minimize design errors, with many software development teams finding that comprehensive DFDs ultimately deliver faster implementation and better system architecture.
Data flow diagrams commonly use processes (circles or rounded rectangles), data stores (open rectangles), external entities (squares), and data flows (labeled arrows). These standardized symbols streamline system analysis by clearly representing how information moves through organizations, with many analysts finding that consistent symbol usage enhances communication between technical teams and stakeholders, ultimately delivering clearer project documentation.
The appropriate DFD detail level depends on your audience, project scope, and documentation requirements, with context diagrams for executives, level-0 for system overviews, and detailed levels for technical teams. Through strategic decomposition, organizations balance comprehensive documentation with practical usability, ensuring stakeholders receive relevant information while maintaining system clarity, ultimately delivering effective communication and streamlined development processes.
Common DFD mistakes include mixing logical and physical elements, creating unlabeled data flows, drawing flows directly between external entities, and creating processes without inputs or outputs. These errors compromise diagram clarity and functionality, with many business analysts finding that careful validation of data flow logic, consistent labeling conventions, and proper boundary definitions ultimately deliver more accurate system documentation and stakeholder understanding.
DFDs support agile development by providing lightweight documentation for data processes, enabling rapid iteration through visual clarity, and facilitating stakeholder communication during sprints. These diagrams streamline requirement gathering, enhance team collaboration, and support continuous integration by quickly identifying data dependencies, with many software teams finding that visual data mapping accelerates development cycles and reduces miscommunication.
Data stores in data flow diagrams serve as repositories where data is held temporarily or permanently between processes, representing databases, files, memory buffers, or other storage mechanisms. These critical components enable data persistence and retrieval across different system processes, with many organizations finding that well-designed data stores streamline information flow, reduce processing delays, and ultimately enhance overall system efficiency and data integrity.
DFDs facilitate communication by translating complex technical processes into clear visual representations that non-technical stakeholders can easily understand, while providing developers with detailed system specifications and data movement patterns. These diagrams enable project managers, business analysts, and development teams to collaborate more effectively on requirements gathering, system design validation, and implementation planning, ultimately delivering faster project timelines and reduced miscommunication risks.
Industries that extensively benefit from DFDs include banking, healthcare, manufacturing, retail, and software development sectors. Financial institutions use DFDs for loan processing and fraud detection systems, while hospitals streamline patient record management and treatment workflows, ultimately enabling organizations to identify inefficiencies, enhance operational transparency, and deliver faster customer services.
Validating a data flow diagram involves checking data store consistency, verifying process logic, confirming external entity interactions, ensuring data flow labeling accuracy, and conducting stakeholder reviews. Through systematic walkthroughs with business users, developers can identify missing processes, incorrect data transformations, and incomplete system boundaries, while cross-referencing with requirements documents ultimately ensures the diagram accurately represents real-world operations and supports successful system implementation.
Software tools for creating data flow diagrams include Lucidchart, Microsoft Visio, Draw.io, Creately, and SmartDraw, along with specialized options like Gliffy and EdrawMax. These platforms streamline diagram creation through drag-and-drop interfaces, pre-built templates, and collaborative features, with many organizations finding that cloud-based solutions enhance team coordination and accelerate system documentation processes.
DFDs help identify system requirements by visualizing data inputs, outputs, processes, and storage needs, revealing gaps in current workflows and highlighting redundant or inefficient processes. Through systematic mapping, organizations streamline operations, enhance data accuracy, and optimize resource allocation, with many businesses finding that DFDs ultimately deliver clearer project scopes and faster implementation timelines.
-
Top Quality presentations that are easily editable.
-
The content is very helpful from business point of view.