

Comparing 2 companies balance sheet ppt diagrams




Try Before you Buy Download Free Sample Product
 Impress Your
 Audience
 100%
100% Editable
 Save Hours
 of Time


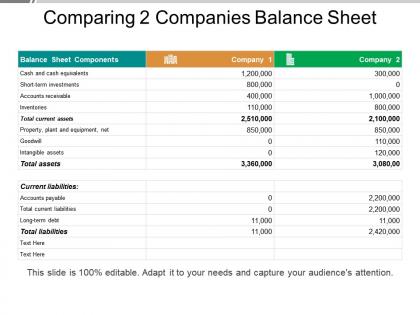
Give a clear idea of the current state of your organization with the help of this 2 Companies Balance Sheet PPT template. Explain the actual financial position of your company to the investors with this readymade PPT template where you just need to replace the sample text with your company’s own figures. This way your investors can get a clear idea about the assets and liabilities of your company and can easily make a comparison with the other company. This comparative analysis will give all the necessary details to your investors, shareholders and employees. Using this template you can give a clear idea of the cash, plant and machinery, land and building and the amount invested by the investors. A thorough analysis of the current liabilities, the short term, and the long term debts can also be done using this PPT slide. Enhance your PPT presentation and give it a professional look with our ready-to-use balance sheet template. Comparing the balance sheet and preparing notes to accounts becomes a tedious task when it comes to preparing yourself that is why we bring to you this professionally build PPT template which can be used conveniently.
People who downloaded this PowerPoint presentation also viewed the following :
Comparing 2 companies balance sheet ppt diagrams with all 5 slides:
Our Comparing 2 Companies Balance Sheet Ppt Diagrams encourage gentle conduct. Your cultured approach will be appreciated.


FAQs for Comparing 2 companies balance
So balance sheets have three main parts: assets, liabilities, and equity. Assets are stuff your company owns - cash, inventory, equipment, whatever. Liabilities? That's what you owe people, like loans or bills you haven't paid yet. Equity is what's left for shareholders after you subtract what you owe from what you own. It's honestly just like personal finances but bigger. Oh, and here's the thing - assets always have to equal liabilities plus equity. If those numbers don't match up, someone messed up the math and you've got problems.
Look at their debt-to-equity ratios first - that'll tell you if they're drowning in debt or managing it well. Current assets vs liabilities shows who can actually pay their bills on time. I always check asset quality too because there's a huge difference between valuable inventory and worthless old stock sitting around. It's basically like snooping on someone's finances, but legal. Oh, and don't just look at one year - trends matter way more than a single snapshot. Those ratios will make it pretty obvious which company has their act together financially.
So when you're looking at balance sheets, current vs non-current liabilities basically show you timing - what's due now versus later. Current stuff (under a year) tells you about immediate cash crunch potential. Non-current is the longer commitments. I usually check their ratio first - think credit cards vs mortgage, you know? Between companies, you'll see different debt structures and who's more squeezed short-term. The real trick is watching trends across quarters. If long-term debt suddenly becomes short-term, that's not great - means liquidity problems might be brewing.
Looking at balance sheets is honestly your best defense against throwing money at garbage companies. Check their debt levels and cash situation first - way more reliable than whatever they're posting on social media. I always look at like 3-4 quarters minimum because one good quarter can be total luck. You'll catch red flags like companies drowning in debt or bleeding assets. It's basically financial stalking before you commit your cash. Compare a few companies in the same space and you'll quickly see who's actually got their shit together versus who's just riding hype.
So balance sheets give you tons of useful ratios. Current ratio is huge - just current assets divided by current liabilities. Quick ratio too for liquidity stuff. Debt-to-equity and debt-to-assets are solid for seeing how much they owe. Asset turnover ratios are honestly my go-to for quick company checkups, maybe even more than income statement stuff. You'll also want ROA and ROE if you're comparing companies. Oh and start with current ratio plus debt-to-equity first - those two will show you right away if a company's financially sketchy or not.
Look at the equity section - it shows how much shareholders actually own versus what's owed to creditors. Strong equity means they're not buried in debt and have built up real value through profits over time. You want positive, growing numbers, not something getting chewed up by losses. Though honestly, some tech companies seem to defy this rule somehow. Higher equity compared to total assets = better cushion when shit hits the fan. Quick move: check if equity's growing year-over-year to see where the company's headed financially.
So basically when a company's debt-to-equity ratio is high, they're borrowing way more money than what the owners actually put in. Could be a red flag. Higher interest payments cut into their profits, and banks might not want to lend them more cash down the road. But honestly, some industries just work that way - utilities and real estate companies typically carry more debt. What matters is comparing it to similar companies and seeing if the trend is getting worse. Oh, and check if they're actually making enough money to pay back what they owe without sweating.
So I'd start by tracking asset turnover ratios across 3-5 years - stuff like inventory turnover, receivables days, total asset turnover. Look for patterns, not just one weird year. The biggest red flag I always watch for? Inventory growing way faster than sales. That's trouble brewing. Check how the mix of current vs fixed assets is shifting too. Cash conversion cycles tell you a lot - are they getting better at turning assets into cash or worse? Honestly, most people skip this analysis but it's where you catch problems early. Track everything consistently and you'll spot the real trends.
Dude, you can't just compare raw numbers between companies - it's totally pointless. A tech startup obviously has way different assets than like a car manufacturer or whatever. Instead, check industry benchmarks for stuff like debt-to-equity and current ratios. Different sectors have their own weird patterns too, especially with seasonal ups and downs. Honestly, comparing Microsoft to Ford is just... why would you even do that? Grab some industry reports first so you're actually comparing apples to apples. Focus on how companies stack up against their actual competitors, not random businesses.
Oh man, seasonal stuff will totally mess with your balance sheet comparisons if you're not paying attention. Like, inventory and cash look completely different in December vs February for retailers - I made this mistake with a client once and it was embarrassing lol. You've gotta compare December 2023 to December 2024, not December to March. Also check working capital trends across multiple quarters instead of just one snapshot. Quick sanity check: ask yourself if the variance is actual performance or just seasonal weirdness. Trust me on this one.
Ugh, the worst thing you can do is compare companies using different accounting methods or fiscal years - it's like comparing a summer quarter to a winter one. Super misleading. Also watch for stuff that's hidden off the balance sheet, like leases that should probably be debt but aren't showing up that way. Don't just stare at raw numbers either. Calculate ratios and look at trends over time - way more useful. Oh, and those footnotes are mind-numbing but read them first. I know it sucks but that's where they hide all the important caveats that'll save you from looking stupid later.
Here's how I'd track liquidity - grab your last 8-12 quarters and compare current assets to current liabilities. Watch for red flags like cash dropping, receivables getting stuck, or short-term debt growing too fast. The current ratio is super handy here (anything under 1.0 is yikes territory). I always check both quarter-over-quarter and yearly trends. Sometimes you'll catch seasonal patterns, but consistent drops? That's trouble brewing. Honestly, a simple spreadsheet with the trends plotted out tells you way more than staring at individual statements.
Okay so first thing - you've gotta standardize the big stuff before comparing anything. GAAP vs IFRS will mess up your whole analysis if you don't adjust first. The main culprits? Revenue recognition, lease accounting, and how they value assets. Depreciation methods are huge too, plus inventory stuff like LIFO vs FIFO. Honestly, intangibles treatment can swing the numbers way more than people expect. Watch for consolidation rules and fair value differences too. Best approach is probably restating one company's financials to match the other's standards, or at least make adjustment columns so you can see the impact side by side.
Dude, those balance sheet numbers can be super misleading without context. Like if Company A has way more debt than Company B, you'd think that's bad, right? But maybe they just bought out their biggest rival or dropped serious cash on some revolutionary tech. Management quality matters too - some CEOs are just way better at execution. Industry stuff, regulations, where they stand against competitors... all that changes everything. I learned this the hard way actually. Don't just look at the raw data and call it a day. The story behind those numbers is where you'll find the real opportunities.
Look at their debt-to-equity ratio first - tells you if they're buried in debt. Cash reserves matter a ton too, companies with good cash can ride out rough patches way better. Check if current assets cover short-term debts, that's basic survival stuff. Honestly, I always look at how their equity's changed over like 3-5 years because it shows if they're actually growing or just treading water. The balance sheet basically shows you whether a company can make it long-term or if they're just skating by.
-
Really like the color and design of the presentation.
-
Colors used are bright and distinctive.