


Cost To Serve Analysis CTS In Supply Chain Powerpoint Presentation Slides




Try Before you Buy Download Free Sample Product
 Impress Your
 Audience
 100%
100% Editable
 Save Hours
 of Time


A process driven accounting method called Cost to Serve is used to determine a customer accounts profitability based on the real business operations and overhead expenses incurred to serve that customer. This is where the given deck will come into assistance. This cost to serve analysis PowerPoint deck includes its agenda, determining current roadblocks, and analyzing current performance of the firm. This presentation highlights various approaches of cost to serve in supply chain. Business people can get benefits by incorporating this presentation as it employs slides that guide you on how firms can utilize cost to serve model. From cost to serve analysis framework to determining different types of cost, addressing cost drivers, and addressing firms profitability this supply chain PowerPoint presentation includes every slide that you must have access to in order to successfully reposition customers and services.
People who downloaded this PowerPoint presentation also viewed the following :
Content of this Powerpoint Presentation
Slide 1: This slide introduces Cost to Serve Analysis (CTS) in Supply Chain. State your company name and begin.
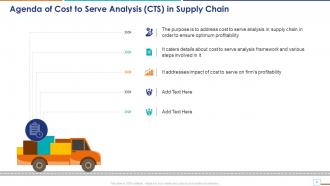
Slide 2: This slide states Agenda of the presentation.
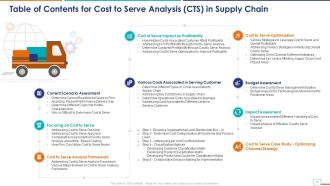
Slide 3: This slide shows Table of Content for the presentation.
Slide 4: This slide highlights title for topics that are to be covered next in the template.
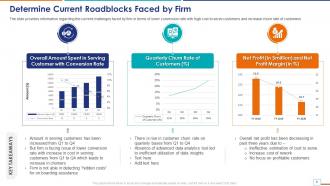
Slide 5: This slide presents Determine Current Roadblocks Faced by Firm.
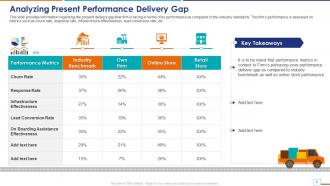
Slide 6: This slide displays Analyzing Present Performance Delivery Gap.
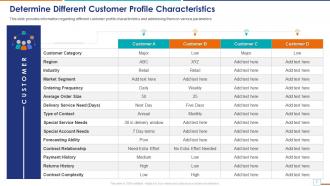
Slide 7: This slide represents Determine Different Customer Profile Characteristics.
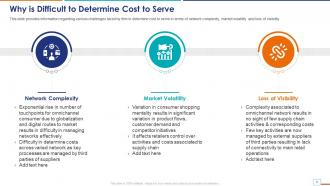
Slide 8: This slide showcases various challenges faced by firm in determine cost to serve in terms of network complexity.
Slide 9: This slide highlights title for topics that are to be covered next in the template.
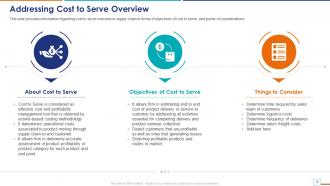
Slide 10: This slide shows Addressing Cost to Serve Overview.
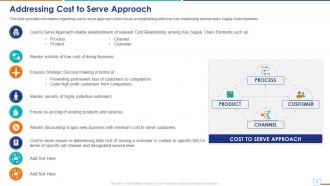
Slide 11: This slide presents Addressing Cost to Serve Approach.
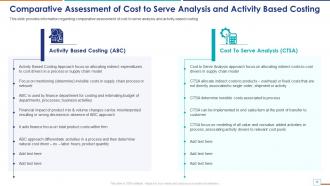
Slide 12: This slide displays Comparative Assessment of Cost to Serve Analysis and Activity Based Costing.
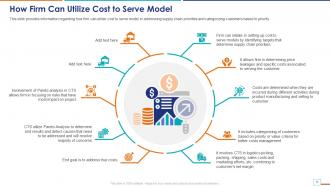
Slide 13: This slide represents How Firm Can Utilize Cost to Serve Model.
Slide 14: This slide highlights title for topics that are to be covered next in the template.
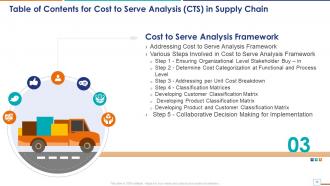
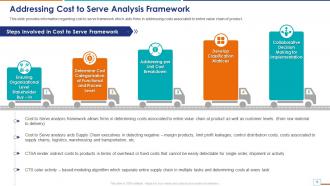
Slide 15: This slide showcases Addressing Cost to Serve Analysis Framework.
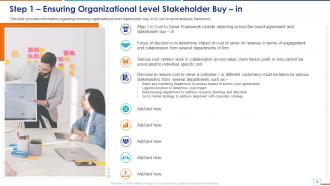
Slide 16: This slide shows ensuring organizational level stakeholder buy- in in cost to serve analysis framework.
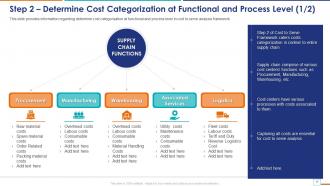
Slide 17: This slide presents Determine Cost Categorization at Functional and Process Level.
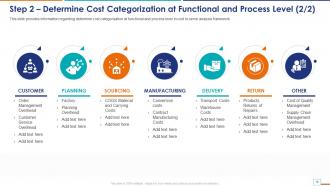
Slide 18: This is another slide continuing determine cost categorization at functional and process level.
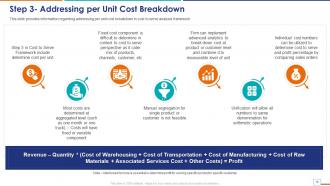
Slide 19: This slide displays addressing per unit cost breakdown in cost to serve analysis framework.
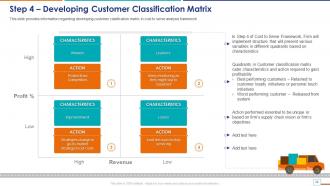
Slide 20: This slide displays Developing Customer Classification Matrix.
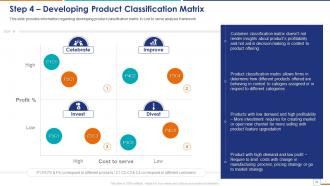
Slide 21: This slide represents Developing Product Classification Matrix.
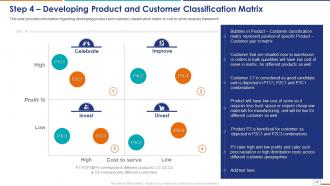
Slide 22: This slide showcases Developing Product and Customer Classification Matrix.
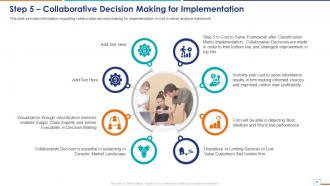
Slide 23: This slide shows Collaborative Decision Making for Implementation.
Slide 24: This slide highlights title for topics that are to be covered next in the template.
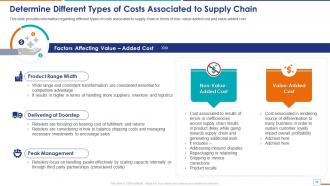
Slide 25: This slide presents Determine Different Types of Costs Associated to Supply Chain.
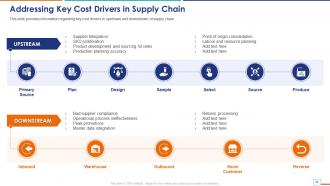
Slide 26: This slide displays Addressing Key Cost Drivers in Supply Chain.
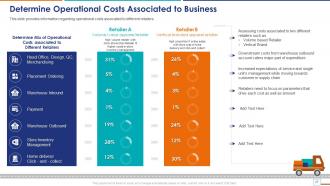
Slide 27: This slide represents Determine Operational Costs Associated to Business.
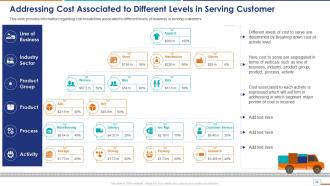
Slide 28: This slide showcases Addressing Cost Associated to Different Levels in Serving Customer.
Slide 29: This slide highlights title for topics that are to be covered next in the template.
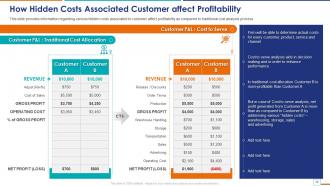
Slide 30: This slide shows How Hidden Costs Associated Customer affect Profitability.
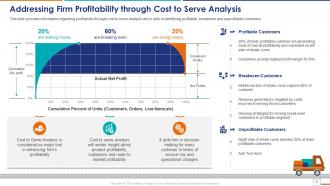
Slide 31: This slide presents Addressing Firm Profitability through Cost to Serve Analysis.
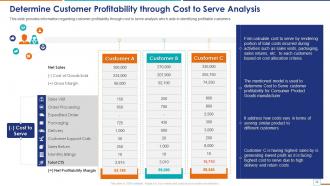
Slide 32: This slide displays Determine Customer Profitability through Cost to Serve Analysis.
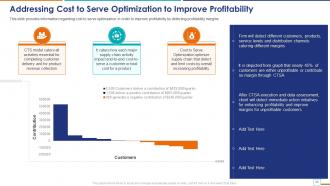
Slide 33: This slide represents Addressing Cost to Serve Optimization to Improve Profitability.
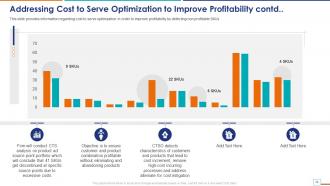
Slide 34: This is another slide continuing Addressing Cost to Serve Optimization to Improve Profitability.
Slide 35: This slide highlights title for topics that are to be covered next in the template.
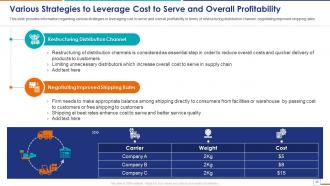
Slide 36: This slide showcases Various Strategies to Leverage Cost to Serve and Overall Profitability.
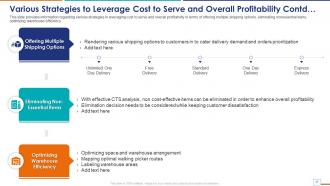
Slide 37: This is another slide continuing Various Strategies to Leverage Cost to Serve and Overall Profitability.
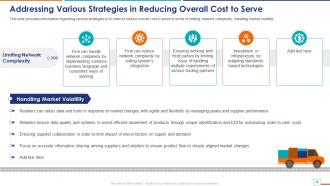
Slide 38: This slide shows Addressing Various Strategies in Reducing Overall Cost to Serve.
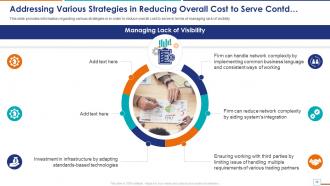
Slide 39: This is another slide continuing Addressing Various Strategies in Reducing Overall Cost to Serve.
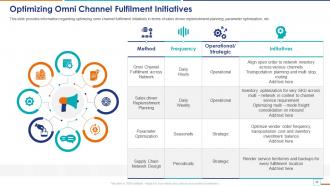
Slide 40: This slide presents Optimizing Omni Channel Fulfilment Initiatives.
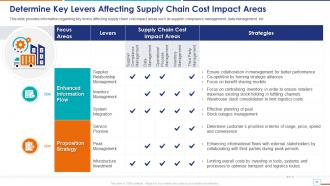
Slide 41: This slide displays Determine Key Levers Affecting Supply Chain Cost Impact Areas.
Slide 42: This slide highlights title for topics that are to be covered next in the template.
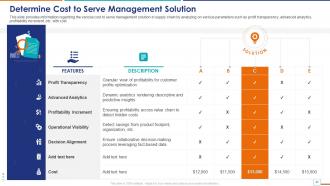
Slide 43: This slide represents Determine Cost to Serve Management Solution.
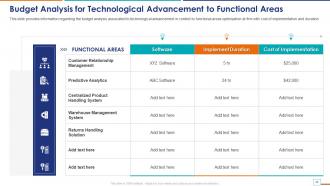
Slide 44: This slide showcases Budget Analysis for Technological Advancement to Functional Areas.
Slide 45: This slide highlights title for topics that are to be covered next in the template.
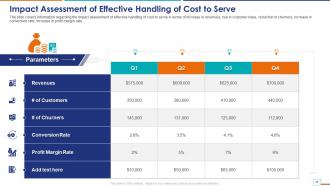
Slide 46: This slide shows Impact Assessment of Effective Handling of Cost to Serve.
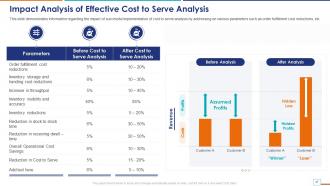
Slide 47: This slide presents Impact Analysis of Effective Cost to Serve Analysis.
Slide 48: This slide highlights title for topics that are to be covered next in the template.
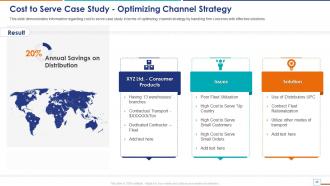
Slide 49: This slide displays cost to serve case study in terms of optimizing channel strategy.
Slide 50: This slide contains all the icons used in this presentation.
Slide 51: This slide is titled as Additional Slides for moving forward.
Slide 52: This slide provides 30 60 90 Days Plan with text boxes.
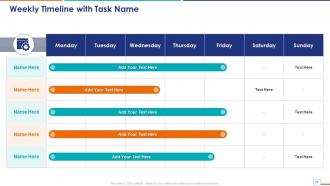
Slide 53: This slide represents Weekly Timeline with Task Name.
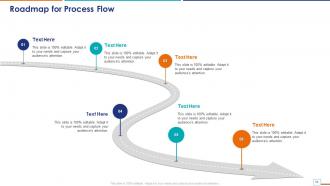
Slide 54: This slide showcases Roadmap for Process Flow.
Slide 55: This slide provides 30 60 90 Days Plan with text boxes.
Slide 56: This slide displays Mind Map with related imagery.
Slide 57: This is Our Goal slide. State your firm's goals here.
Slide 58: This slide contains Puzzle with related icons and text.
Slide 59: This is an Idea Generation slide to state a new idea or highlight information, specifications etc.
Slide 60: This is an Idea Generation slide to state a new idea or highlight information, specifications etc.
Slide 61: This is About Us slide to show company specifications etc.
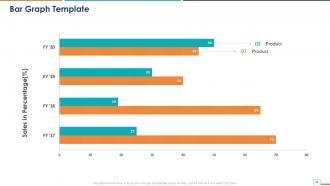
Slide 62: This slide presents Bar chart with two products comparison.
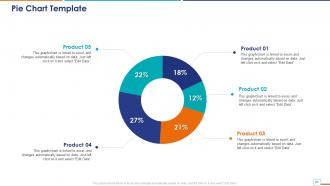
Slide 63: This slide shows Pie Chart with data in percentage.
Slide 64: This is a Comparison slide to state comparison between commodities, entities etc.
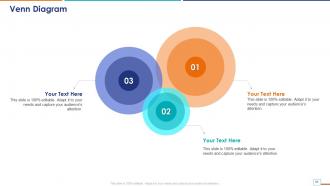
Slide 65: This slide depicts Venn diagram with text boxes.
Slide 66: This slide shows Post It Notes. Post your important notes here.
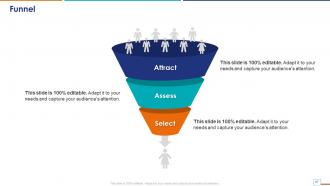
Slide 67: This slide shows Funnel with additional textboxes.
Slide 68: This is Our Mission slide with related imagery and text.
Slide 69: This slide presents Roadmap with additional textboxes.
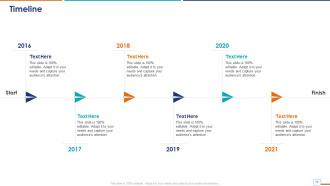
Slide 70: This is a Timeline slide. Show data related to time intervals here.
Slide 71: This is Our Team slide with names and designation.
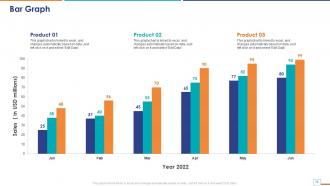
Slide 72: This slide presents Bar chart with two products comparison.
Slide 73: This is a Timeline slide. Show data related to time intervals here.
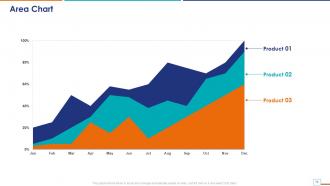
Slide 74: This slide depicts Area chart with two products comparison.
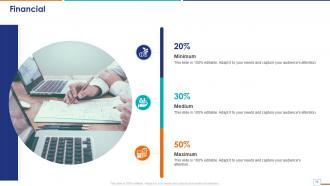
Slide 75: This is a Financial slide. Show your finance related stuff here.
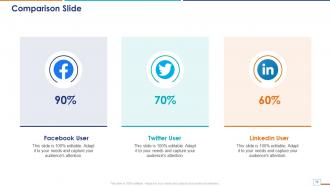
Slide 76: This is a Comparison slide to state comparison between commodities, entities etc.
Slide 77: This slide shows Stacked with text boxes.
Slide 78: This is a Thank You slide with address, contact numbers and email address.
Cost To Serve Analysis CTS In Supply Chain Powerpoint Presentation Slides with all 83 slides:
Use our Cost To Serve Analysis CTS In Supply Chain Powerpoint Presentation Slides to effectively help you save your valuable time. They are readymade to fit into any presentation structure.









FAQs for Cost To Serve Analysis CTS In Supply Chain
So Cost to Serve Analysis basically tracks every single expense that goes into getting products to your customers - not just the product costs, but warehousing, shipping, customer service, all of it. You'll be surprised how much some customers actually cost you! Like, one customer might order tiny amounts constantly while another needs special handling or lives somewhere that's crazy expensive to ship to. The whole point is figuring out which customers are actually profitable since they definitely aren't all equal. Once you see the real numbers, you can adjust pricing or decide who's worth focusing your growth efforts on.
Cost to Serve Analysis is your friend here - it shows you which customers are actually making you money vs. the ones bleeding you dry. Map out everything: delivery costs, support time, payment hassles, all of it. I'd start with your biggest 20 accounts first since that's where you'll see the most impact. Honestly, some "good" customers on paper turn out to be total profit killers when you dig into the real numbers. Once you've got the data, you can adjust pricing based on service levels or renegotiate terms. Sometimes you might even need to cut ties with the worst ones (I know, scary but necessary).
You'll need revenue data for each customer, plus all the direct costs - product costs, warehousing, shipping, sales support hours, customer service time. Order patterns are huge here since frequent small orders cost way more to handle than bulk purchases. Don't overlook the annoying stuff like returns and special packaging requests - honestly, those random customizations can kill your margins. Factor in what you spent acquiring each customer and any promos you ran for them. The whole point is seeing where every dollar goes so you can figure out which customers are actually making you money versus the ones bleeding you dry.
So basically, Cost to Serve flips the whole customer thing around - instead of just looking at who buys the most, you see who's actually making you money. Some customers are total goldmines because they buy a lot but never call support. Others? They're basically expensive divas who want custom everything and constant hand-holding. Your "VIP" might actually be bleeding you dry, which is kinda wild when you think about it. Use this info to figure out where to spend your marketing budget and how to structure your service levels. Give the profitable ones the red carpet treatment, but maybe push the costly ones toward self-service options.
So Cost to Serve Analysis basically tracks every single expense that goes into serving a customer - not just making the product, but shipping, customer support, sales calls, all that stuff. You'd be shocked how many "profitable" customers are actually money pits once you factor in all the hand-holding they need. Like that client who places tiny orders every week or returns half their stuff. The analysis shows you which relationships are quietly bleeding your margins dry. Once you see the real numbers, you can either change how you deal with these customers or just... cut them loose honestly.
So technology basically does all the grunt work for you - no more building spreadsheets for weeks straight. Modern platforms pull from your ERP, CRM, logistics systems automatically to show real customer profitability. The visual stuff is where it gets really cool though, you can spot weird patterns immediately. Honestly saves so much time on data gathering. You end up focusing on what the numbers actually mean instead of just collecting them. I'd start by figuring out where your cost data lives, then find something that connects it all. Way better than the old manual approach.
At minimum, do it once a year. But honestly? Every 6 months if your industry moves fast. Costs change constantly - new suppliers, process tweaks, different customer mix. Wait too long and you're basically flying blind with old numbers. Major shifts like new warehouses or big customer changes? Update immediately, don't wait for your regular schedule. I learned this the hard way when our whole profitability picture was off because we hadn't updated in 8 months. Set a calendar reminder and actually stick to it - treating it like any other business review that actually matters.
Yeah definitely! Cost to Serve is kinda useless by itself tbh. What you want to do is pair it with customer lifetime value and profit margins - that's where things get interesting. I always tell people to throw in retention rates too because you'll see patterns between service costs and how loyal customers actually are. The cool part is when you segment customers based on all this stuff together. You'll find those high-maintenance clients who are actually worth it versus the ones just bleeding you dry. Oh and build a simple dashboard so you're not drowning in spreadsheets. Start with maybe 2-3 metrics that actually matter to your goals.
Data collection is gonna be your biggest headache - trust me on this one. Getting accurate cost info from every touchpoint? Total pain at first. Finance and ops teams will need to actually talk to each other, which gets messy if they're used to staying in their lanes. Then there's the whole nightmare of splitting shared costs fairly between customers. Your current systems probably can't track costs per customer anyway, so you'll be doing workarounds manually for a while. Oh, and definitely pilot this with just a few customers first before going all-in company-wide.
So Cost to Serve Analysis breaks down exactly what you're spending to get products to each customer or segment. Super useful for logistics stuff. You'll spot your priciest delivery routes and figure out which customers actually make you money once shipping's factored in. Honestly, the variation between routes can be crazy - I've seen some that cost 3x others. Map out your current costs by customer or route first. You might find some weird patterns. Then you can make better calls on warehouse spots, carrier deals, maybe even repricing some accounts. Great for finding consolidation opportunities too.
Look, Cost to Serve Analysis isn't about ditching unprofitable customers - that's backwards thinking. Instead, figure out WHY they're expensive to serve. Are they calling support nonstop because your onboarding is trash? Placing a million tiny orders because your system's confusing? Once you spot these patterns, fix the actual problems. Better self-service options, clearer processes, maybe even product tweaks. I've seen companies turn their worst customers into their best ones this way. The goal is removing friction for everyone while cutting your costs at the same time.
Honestly, just start with Excel and your biggest customers - maybe 5-10 of them from different segments. Track the basics: delivery costs, support time, any special stuff they need. Nothing fancy required (I mean, who has budget for consultants anyway?). Calculate what each one actually costs you beyond your regular product costs. Do it manually at first. You'll be shocked at which customers are bleeding you dry versus the profitable ones. Then tweak your pricing or cut back on the extras for the problem accounts. Simple but it works.
Look, everyone thinks Cost to Serve means just dumping expensive customers, but that's backwards. You're actually trying to fix how you deliver services across the board. Plus companies do this analysis once and call it done - which is dumb because customer behavior shifts all the time. Here's the thing that gets me: high-cost customers aren't automatically losers. Sometimes they're totally worth the extra effort. The real win? Finding patterns so you can redesign your processes instead of just ditching annoying clients. Oh, and map out where you actually touch customers first.
Honestly, Cost to Serve is a game-changer for getting your SLAs right. It shows you exactly which service levels are killing your margins - like that 24-hour response time that sounds amazing but probably costs way more than you're charging. You'll see where you're basically giving away money by over-delivering. Then you can flip it around and figure out where premium service actually makes sense. I've seen companies just guess at their SLA tiers, which is nuts when you think about it. Use the real cost data to price things properly and match your service levels to what each customer segment is actually worth. Makes the whole thing way more profitable.
You've gotta tailor your Cost to Serve model to your specific industry - generic approaches are pretty much useless. Manufacturing means looking at batch sizes, setup costs, equipment utilization. Retail's all about store formats, inventory turns, seasonal swings. Healthcare? Those regulatory compliance costs will eat you alive if you don't account for them. Financial services need transaction volumes and customer risk profiles baked in. I learned this the hard way on a project last year. Map out your industry's main cost drivers first, then figure out what customers actually need from you. Build around those specifics instead of some cookie-cutter framework.
-
Wonderful templates design to use in business meetings.
-
The PPT layout is great and it has an effective design that helps in presenting corporate presentations. It's easy to edit and the stunning visuals make it an absolute steal!