


Doughnut chart for data visualization comparison of percentages powerpoint slides design





Try Before you Buy Download Free Sample Product
 Impress Your
Audience
 100%
Editable
 Save Hours
of Time


Create a demand for better infrastructure with our Doughnut Chart For Data Visualization Comparison Of Percentages Powerpoint Slides Design. Boost the availability of jobs.
People who downloaded this PowerPoint presentation also viewed the following :
Content of this Powerpoint Presentation
Description:
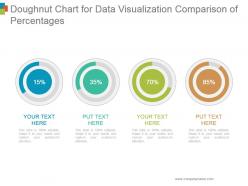
The image is a PowerPoint slide titled "Doughnut Chart for Data Visualization Comparison of Percentages." It contains four doughnut charts, each representing a different percentage—15%, 35%, 70%, and 85%—and color-coded in blue, green, lime, and brown, respectively. Under each chart is a placeholder text for customization, reading "YOUR TEXT HERE" or "PUT TEXT HERE."
Use Cases:
This visualization tool can be adapted for various industries:
1. Marketing:
Use: Analyzing campaign reach or conversion rates.
Presenter: Marketing Analyst
Audience: Marketing team, stakeholders
2. Education:
Use: Displaying student performance statistics.
Presenter: Academic Researcher
Audience: Faculty, educational administrators
3. Finance:
Use: Reporting financial health or budget allocation.
Presenter: Financial Advisor
Audience: Investors, company executives
4. Healthcare:
Use: Showcasing patient demographics or treatment outcomes.
Presenter: Healthcare Data Analyst
Audience: Medical staff, hospital management
5. Technology:
Use: Illustrating usage statistics for software or platforms.
Presenter: Product Manager
Audience: Developers, product teams
6. Real Estate:
Use: Comparing occupancy rates or property values.
Presenter: Real Estate Analyst
Audience: Investors, real estate agents
7. Manufacturing:
Use: Representing production efficiency or quality control levels.
Presenter: Operations Manager
Audience: Production team, quality assurance staff
Doughnut chart for data visualization comparison of percentages powerpoint slides design with all 5 slides:
Avoid a ham handed approach with our Doughnut Chart For Data Visualization Comparison Of Percentages Powerpoint Slides Design. Always appear in complete control.


FAQs for Doughnut chart for data visualization comparison of percentages
Honestly, the biggest win is that empty center - you can throw your totals or key numbers right in there instead of having them floating around somewhere else. Pie charts can't do that obviously since they're just solid circles. Also way easier to compare multiple datasets by stacking rings versus having like 3 different pie charts cluttering up your slide. The whole thing looks cleaner too, more modern I guess? And weirdly the empty middle actually helps you read the segments better since there's no focal point pulling your eye inward. Don't waste that center space though - put your most important stat there.
Honestly, doughnut charts are clutch when you've got 3-5 categories tops showing parts of a whole. More than that? Total mess. Budget breakdowns, market share stuff, survey results - that's their sweet spot since percentages matter more than exact numbers. That center space is perfect for your total or whatever key number you want to highlight. Don't bother if you have tiny slices under 5% though - nobody can tell them apart anyway. If you don't need the center space, just go with a regular pie chart. But when you want to show both the breakdown AND emphasize the total? Doughnuts win every time.
Dude, colors totally make or break donut charts! Red screams "danger" even when it's just showing neutral data. Green feels positive, orange grabs attention - use that for your key point. I once made adjacent slices nearly identical colors and it looked awful, nobody could tell them apart. High contrast between neighboring segments is clutch. Oh and definitely check if colorblind people can read it too. Your most important slice should get the boldest color and go first. Honestly, half the battle is just not making people squint at similar shades.
Don't go crazy with categories - 5 or 6 max, seriously. Thin slices are impossible to read, and similar colors will make you want to scream later (trust me on that one). Put your biggest slice at the top and work clockwise from there. Clear labels are everything - stick your legend close by or better yet, label right on the slices if they're big enough. Oh, and skip those weird 3D effects. They look cool but totally mess with how people read the actual data. You'll thank me later when people can actually understand your chart instead of squinting at it.
Honestly, stick to 3-7 segments tops for doughnut charts. More than that? Total nightmare to read. I usually aim for 4-5 since people can actually compare those sizes without squinting. Got tons of categories? Lump the tiny ones into "Other" or just pick a bar chart instead - sometimes doughnuts aren't worth the hassle. Your readers should get the main point in like 3 seconds. Oh, and sketch it out first! Sounds old school but you'll spot weird proportions way faster on paper than staring at Excel.
Nah, doughnuts get pretty ugly once you hit 6+ categories. People can't really compare all those angles - especially when the values are close. It turns into this messy pie situation where nobody can tell what's what. Horizontal bar charts work way better for that many categories. You can actually read the labels without squinting. If you're dead set on keeping the doughnut though, maybe lump the smaller stuff into an "Other" category? I've seen people try to cram like 10 categories in there and it just looks... chaotic. Five max is the sweet spot.
Oh man, labels are literally everything for doughnut charts. Without them you're just showing people a colorful circle and expecting them to figure it out somehow. Put the category name AND the percentage on each slice - don't make people look at a separate legend because that's just annoying. The center space is perfect for your total or main number too. I learned this the hard way when my boss stared at my chart for like 30 seconds straight. If someone needs more than a quick glance to get it, you need more labels.
Doughnut charts are perfect for this! The outer ring shows your part-to-whole breakdown - budget categories as percentages of total spend, whatever. Then use the inner space for comparing specific segments. You can add labels or even nest a smaller chart inside. Color coding is huge here - group similar categories with related colors so the comparisons actually stand out. Honestly, I think doughnut charts are way more flexible than people give them credit for. Just make sure your labeling is clear so people can see both the individual slices and how they compare to each other.
Honestly just start with whatever you've already got - Excel or Google Sheets work fine for basic doughnut charts. Excel's actually not awful anymore for making decent-looking visuals. If your company pays for Tableau or Power BI, those are way better for interactive stuff. There's also online options like Canva or Chart.js if you're into that. I mean, I spent like an hour last week trying to get the perfect color scheme in Excel when I should've just picked something and moved on. The actual data you're showing matters way more than making it super fancy anyway.
Honestly, that empty space in the middle is clutch for readability. Makes everything way less cramped than regular pie charts. I always throw the main number right in the center - like "Total Sales: $50K" or whatever matters most. It becomes this perfect focal point that people notice first. Plus you can get creative with icons or extra context if you want. The breathing room really helps when you've got tons of categories too. Trust me, it's so much cleaner looking. Way less overwhelming for whoever's trying to make sense of your data.
Hey! So doughnut charts are pretty useless when you've got tons of categories - like more than 5 or 7 gets ridiculous. They can't handle negative numbers either. Honestly, they're the worst for time series stuff because... how do you show January to December in a circle? Makes no sense. When your data segments are super different sizes, the tiny ones just disappear. Plus if you need people to actually compare values precisely, forget it. Bar charts or line graphs will save you every time. Trust me, your audience won't be squinting at weird pie slices trying to figure out what's bigger.
Dude, animations totally make doughnut charts way more interesting. Having segments grow from zero to full size creates this cool reveal effect that actually keeps people watching. When your data changes, smooth transitions help viewers follow what's happening instead of just - boom - new numbers appear out of nowhere. I've seen some really nice ones where segments pulse when you hover over them. Just don't go crazy with timing though. Keep it snappy, like 1-2 seconds max. Any longer and honestly? People zone out instead of paying attention. The whole point is grabbing focus on your key data points.
Don't cram all your text inside the pie slices - it looks terrible. Put annotations outside with those little leader lines instead. Only call out the really important stuff, not every single piece of data. I learned this the hard way after making charts that looked like someone threw alphabet soup at them. Use consistent formatting so it doesn't look sloppy. If you've got tons of categories, just go with a legend instead. Position everything where there's empty space so nothing overlaps. The whole point is highlighting key insights without creating visual chaos.
Honestly, doughnut charts work best when they actually support whatever point you're making - don't just slap them in randomly. I like using them right after explaining a concept that breaks into clear categories. Perfect for exec dashboards since they're clean and easy to scan. The animation thing is clutch too - reveal each segment one by one during live presentations to keep people hooked. They're solid visual anchors that help your story flow better. But here's the thing - start with what you're trying to say first, then figure out if a breakdown actually adds value there. Otherwise you'll end up with pretty charts that don't do much.
Your audience's cultural background totally affects how they'll read doughnut charts. Most Western people start at 12 o'clock and scan clockwise, but other cultures might read differently. Colors are tricky too - red screams "danger" to some folks, "good luck" to others. Some cultures think more holistically instead of breaking things into neat little segments, which honestly makes sense when you think about it. Before launching anything, run it by teammates from different backgrounds first. Or just use neutral colors and slap on clear labels so everyone gets it regardless of where they're from.
-
Graphics are very appealing to eyes.
-
Thanks for all your great templates they have saved me lots of time and accelerate my presentations. Great product, keep them up!