

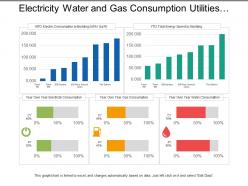
Painel de consumo de serviços públicos de eletricidade, água e gás.





Try Before you Buy Download Free Sample Product
 Impress Your
Audience
 100%
Editable
 Save Hours
of Time


Enfrente insinuações com nosso Painel de Utilidades de Consumo de Eletricidade, Água e Gás. Exponha quaisquer alegações falsas que estejam sendo feitas.
Consumo de eletricidade, água e gás
Use
Monitoramento e análise do consumo de serviços públicos
Advantage
Otimização do uso de recursos e redução de custos
People who downloaded this PowerPoint presentation also viewed the following :
Painel de consumo de serviços públicos de eletricidade, água e gás com todas as 5 slides.
Garanta a consistência do início ao fim com nosso Painel de Consumo de Serviços Públicos de Eletricidade, Água e Gás. Seja capaz de lidar com condições intermediárias.


FAQs for Electricity water and gas
So definitely track the big four: energy use (kWh, therms), cost trends, demand peaks, and efficiency ratios. Weather normalization is huge too since temperature changes throw everything off - learned that the hard way. Real-time vs. budget comparisons help catch issues early. Sustainability metrics matter if your company cares about that stuff. Oh, and honestly? Don't overcomplicate the dashboard. You want something you can glance at and actually understand, not some overwhelming mess of data that looks impressive but tells you nothing useful when you're trying to make quick decisions.
Dude, real-time data is huge for catching problems before they cost you serious money. You'll see energy spikes instantly, spot equipment that's acting up, weird consumption patterns - all that stuff that usually means leaks or something's about to break. Way better than waiting around for monthly reports, honestly. Instead of always being behind, you're actually ahead of issues. Your response time gets so much faster, and you can shift resources based on what's happening now instead of old data. Oh and start with your most critical stuff first - don't try to monitor everything at once.
Create different dashboards for each group - execs get the big picture KPIs while ops teams see real-time alerts and granular data. Obviously your CFO doesn't need to know about valve pressures lol. Put critical stuff at the top and keep colors consistent across views. Daily reports for operations, weekly for management works well. Here's the thing though - just ask people what they actually want instead of assuming. I've seen too many beautifully designed dashboards that nobody uses because they show the wrong metrics. Save yourself the headache.
Honestly, good visualizations are a game-changer for utility dashboards. Nobody wants to scan through endless spreadsheet rows - charts and graphs make energy data actually make sense. Heat maps show you exactly when usage spikes, progress bars tell you if you're hitting budget limits. Line graphs work great for tracking trends over time. Pie charts? Perfect for breaking down energy sources. I'd start by figuring out the top 3 questions your users always ask, then design visuals that answer those right away. Oh, and gauges are surprisingly effective for showing efficiency metrics at a glance.
Honestly, Tableau and Power BI are your best bets for utilities stuff - they handle all that messy energy and water data really well. Grafana's incredible for real-time monitoring if you need live meter readings (I'm slightly obsessed with how smooth it is). You could build something custom with Python and Plotly Dash, but that means way more coding. Power BI's probably the easiest starting point since it plays nice with whatever Excel files you've got lying around. Oh, and their free version is actually decent - try that first before spending money. Should give you a good feel for whether it can handle your dashboard complexity.
Connect straight to your utility meters or SCADA systems instead of manual data entry - trust me on this one. Set up alerts for weird spikes or missing readings because our dashboard once showed negative power for a whole week lol. Also do weekly checks against your actual utility bills to catch any drift. Timestamp handling is crucial too, and double-check your units conversion or you'll end up like we did wondering why one building apparently uses 50x more water than physically possible. Spot-checking against source systems saves you from looking stupid later.
So your utility dashboard looks at past data to predict what's coming next - equipment failures, energy spikes, maintenance stuff. Pretty neat actually. Like it'll warn you a transformer might crap out next month or that summer's gonna hit you with 20% higher demand. Way better than dealing with surprise outages, right? You can plan maintenance ahead of time instead of running around fixing things in a panic. Honestly, I'd just focus on the alerts that mess with your day-to-day operations first. Saves money and headaches.
So basically it tracks all your compliance stuff automatically - no more pulling data from like 5 different systems when deadlines hit. Real-time monitoring catches problems before they become violations, which is clutch. Reports get generated without you having to do anything, and honestly? Game changer during audits since everything's timestamped and documented how regulators want it. I'd start by figuring out your biggest compliance headaches first, then set up alerts for those. Way better than the old spreadsheet nightmare we used to deal with.
Honestly, the worst part is getting all your data sources to play nice together. Some dump CSV files, others have APIs, and legacy systems? Total nightmare with their weird formats. One source updates every hour while another only syncs once a day - makes your dashboard look super inconsistent. Plus each system has different security permissions which becomes a huge hassle. Oh, and you'll definitely underestimate how long the data mapping takes. Trust me on this one. Start with just 2-3 sources max and get those working perfectly before you even think about adding more stuff.
User feedback is literally your roadmap for what to fix first. People complain about confusing navigation? That's your next update. I've watched entire dashboard layouts get flipped because users were ignoring half the data - they just wanted the basics upfront, not fancy visualizations. Feedback also shows which alerts actually help vs. which ones are just annoying noise. Start collecting input early though, because what you think utility managers need and what they actually use day-to-day can be completely different. Honestly, assumptions will bite you every time.
Dude, mobile access for utility dashboards is a total lifesaver. Field techs can pull up real-time data while they're literally standing next to broken equipment - no more radio calls back and forth. You're not stuck at your computer when alerts go off at 2am either. Response times get way faster since everyone can see what's happening instantly. Teams coordinate better too. Honestly, I learned this the hard way after dealing with outages where half the crew couldn't access anything. Make sure whatever system you pick actually works decent on phones and tablets though.
So dashboards are honestly game-changers for this stuff. You get real-time data on carbon emissions, energy use, water consumption - all that environmental tracking you need. The visual charts beat the hell out of spreadsheets any day. Set up alerts so you know when you're falling behind targets. Break everything down by location or department to see what's actually working. Oh, and you can track trends over time which is pretty cool. My advice? Pick your top 3-5 sustainability metrics first and start there. Don't try to visualize everything at once - you'll just overwhelm yourself.
So basically it's all about who's using it and when. Operational dashboards are for your day-to-day stuff - outages, equipment status, current demand. Your control room folks need that info right now, not tomorrow. Strategic ones? Totally different vibe. Executives looking at quarterly trends and long-term planning don't care if a transformer went down 20 minutes ago. Most companies end up building both anyway, which honestly makes sense. Just figure out who's gonna be staring at this thing every morning first - that'll save you a ton of headaches later.
Honestly, those utility dashboards are game-changers for spotting where you're wasting resources. Peak demand periods become super obvious when you see the real-time data - then you can actually move your maintenance crews around based on what's happening, not just random scheduling. I was shocked at how much money we were throwing away until everything got laid out visually like that. Historical trends help predict what's coming next too. Oh, and definitely start with whatever's eating your budget the most. That's where you'll feel the difference right away instead of messing around with small stuff first.
So right now it's all about AI predicting outages before they actually happen - which is pretty wild if you think about it. Real-time IoT stuff is everywhere, and everything's gotta work on mobile first. Smart grids aren't just buzzwords anymore, they're actually working. Customer dashboards are getting gamified too, like turning energy savings into some kind of competition. Voice controls are creeping in, even some AR features. Honestly though? Start with mobile responsiveness and real-time data. Those aren't nice-to-haves anymore, they're basically required for any dashboard worth building.
No Reviews