


Employee Separation Dashboard With Exit Reason




Try Before you Buy Download Free Sample Product
 Impress Your
 Audience
 100%
100% Editable
 Save Hours
 of Time


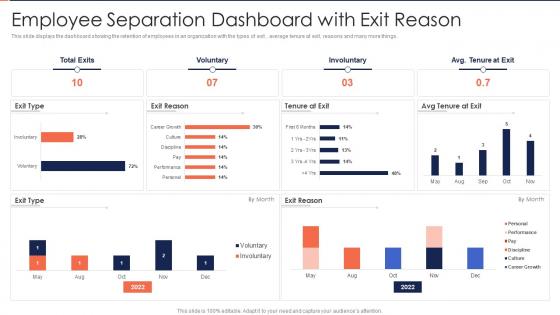
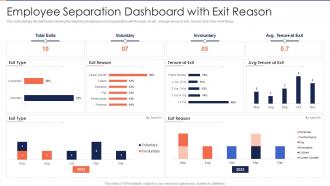
This slide displays the dashboard showing the retention of employees in an organization with the types of exit , average tenure at exit, reasons and many more things.
People who downloaded this PowerPoint presentation also viewed the following :
Employee Separation Dashboard With Exit Reason with all 7 slides:
Use our Employee Separation Dashboard With Exit Reason to effectively help you save your valuable time. They are readymade to fit into any presentation structure.





FAQs for Employee Separation Dashboard
So from what I'm seeing in the exit data, about 60% of people are leaving because of pay gaps and dead-end career paths. Manager issues are brutal too - toxic leadership is driving another 25% out the door. Work-life balance problems hit the hardest in those crazy demanding departments, which honestly makes total sense. The breakdown by tenure and role gets pretty revealing though. I'd definitely pull up that detailed dashboard and filter it by your actual teams - the patterns might look totally different for your specific people.
So basically, predictive analytics looks at all your employee data - engagement surveys, performance reviews, when people get promoted, stuff like that. It spots patterns before people actually quit. Like maybe it notices folks who stop joining training sessions or collaborating less tend to leave within 6 months. Honestly, it's kind of scary how accurate these models get once they learn your company's specific patterns. You can focus your retention efforts on the high-risk people before they even start updating their LinkedIn. Just figure out what employee data you're already collecting and find tools that can analyze it for red flags.
Track time-to-completion and exit interview participation rates first. Knowledge transfer completion percentages matter too. I'm honestly obsessed with participation rates though - they show if people actually feel heard when they're leaving. Manager satisfaction scores tell you if your process is helping or just creating more work for them. Compliance stuff is boring but crucial - missing final pay deadlines will cause headaches later. Equipment return tracking too. Departing employee satisfaction gives you the full picture. Start with these basics, then you can get fancy with more detailed metrics once you've got your baseline down.
Exit interviews show you why people actually quit - it's seriously valuable stuff. Most companies just dump it in a spreadsheet though, which drives me crazy. Look for patterns first. Are three people complaining about the same terrible manager? That's your smoking gun right there. Find the top few issues that keep coming up and fix those. Don't try to solve everything at once. Share the anonymous feedback with leadership so they can't ignore what's really happening. People usually leave for pretty predictable reasons once you dig into it.
Honestly, tracking employee satisfaction is like having a crystal ball for turnover. Satisfaction drops first, then 3-6 months later people start leaving. I've seen it happen so many times. Don't just look at satisfaction scores though - you need the whole picture with engagement data, how people feel about their managers, career growth stuff. The smart move? Set up alerts when scores hit certain lows so you can actually do something before they quit. Way easier to fix problems early than scramble when half your team's already mentally checked out.
Look, start with SHRM or BLS data - they break everything down by industry and company size. LinkedIn's Workforce Report is solid for quarterly stuff too. But honestly? Industry averages are just your baseline. Calculate your monthly and annual rates first, then dig into the department breakdowns. That's where you'll actually see what's happening. A 15% overall rate might look fine until you realize your engineering team is at 30%. Don't get stuck comparing just the top-line number. Segment by tenure too - losing people after 6 months hits differently than 3 years. Focus on where you're actually bleeding talent vs normal churn.
Ugh, turnover is such a budget killer. You've got recruitment costs, training new people, and productivity just tanks while positions sit empty. The worst part? Your current team gets stuck doing double duty. Studies say replacing someone costs 50-200% of their salary - which honestly seems low when you factor in all the chaos. Then there's losing all that knowledge when people leave, which you can't even quantify. I'd start tracking separation metrics so you can see where you're bleeding money the most and focus your retention efforts there.
Oh totally, demographics are huge for predicting who's gonna leave. Age is the biggest one - younger employees bounce around way more, which honestly makes sense when you're still figuring out your career. I'd start by breaking down your data by age and how long people have been there. Those two usually tell the biggest story. Gender and ethnicity can reveal interesting stuff too, depending on your company culture (sometimes in uncomfortable ways, tbh). Different departments often have wildly different turnover patterns. Don't just look at the overall numbers - you'll miss all the good insights that way.
Start with a basic monthly turnover dashboard - you can always add more later. Heat maps are clutch for spotting which teams or managers have the worst separation rates. I'm obsessed with trend lines because they make seasonal patterns super obvious (like, did the great resignation actually happen at your place?). Dashboards beat the hell out of spreadsheets for showing turnover by department, tenure, all that demographic stuff. Interactive charts let you dig into specific groups too - new hires in their first 90 days, whatever. Just build it simple first, then see what questions pop up.
Honestly, there's a bunch of stuff that could bite you here. Wrongful termination and discrimination lawsuits are the big ones. WARN Act compliance too if you're doing mass layoffs. The data privacy angle gets messy - can't just analyze any employee info you want without proper consent and legitimate reasons. State laws are all over the place, so something that works in Texas might land you in hot water in California. Document everything and stick to actual business metrics, not protected characteristics when you're tracking this stuff. Oh and definitely get your legal team involved before rolling out any new separation tracking - learned that one the hard way at my last job.
So you take their annual contribution - basically revenue they bring in minus what you pay them plus overhead - and multiply by how long you expect them to stick around. Defining "contribution" gets weird though, especially for support roles and stuff. Then compare that lifetime value against replacement costs (recruiting, training, the whole mess of getting someone new up to speed). That gap shows you exactly how much you can spend on retention without losing money. Honestly, I'd start with your top performers since the math is clearest there. Makes it way easier to sell leadership on better benefits or keeping flight-risk people happy.
Exit interviews are pure gold for this stuff. They'll tell you exactly why people are bailing. Also dig into employee survey comments and any feedback from performance reviews that managers wrote down. Skip surveys are honestly where people really spill - especially those written sections where they just go off about what's bugging them. Oh, and check Glassdoor if you can (ethically, obviously). Match up what you're hearing in exit interviews with your worst turnover departments. That's where you'll find the real patterns. Short surveys never tell the whole story anyway.
Honestly, exit interviews are like a goldmine if you actually dig into them. Pull your last two years of turnover data and look for patterns - maybe your marketing folks always bail after 18 months because there's nowhere to grow. Boom, now you know to sell career paths hard when recruiting for those spots. I'd also flip it and see which people stick around longest, then hunt for more candidates like them. Breaking it down by department and role length shows you exactly where the cracks are. Way easier than guessing what went wrong after someone's already walked out the door.
Check your HRIS first - Workday, BambooHR, those guys usually have decent analytics built in for basic separation stuff. Excel's still surprisingly good for quick analysis, honestly better than people give it credit for. Tableau looks way cooler if you're showing leadership though. Want to get into predictive modeling? That's R or Python territory. But seriously, start simple with whatever you already have access to. I've seen too many people jump straight into complex ML stuff when basic trend analysis would've told them everything they needed to know.
Honestly, bad managers and toxic culture will tank your retention faster than anything else. I've literally watched entire teams get decimated because of one terrible supervisor - it's wild how quickly people bail. The stats back this up too: people don't quit companies, they quit their bosses. When you're digging into your turnover data, check if certain departments are bleeding talent. That's usually a dead giveaway it's a management problem, not something wrong with the whole organization. Oh, and definitely prioritize manager training over other retention stuff. Culture fixes take time but they're worth it.
-
“As you have innovative ideas and they are all customizable, this saves a huge chunk of your time to prepare well-read presentations.”
-
SlideTeam is my one-stop destination for templates. Highly recommended!