


End user journey mapping powerpoint presentation slides




Try Before you Buy Download Free Sample Product
 Impress Your
 Audience
 100%
100% Editable
 Save Hours
 of Time


Represent the customer experience with this End User Journey Mapping Powerpoint Presentation Slides. Understand the purpose of customer mapping which helps to tell the story of a customer's experience with your brand. Take the assistance of this journey map PowerPoint visuals and mention objectives, needs, feelings and barriers of customer journey mapping. Utilize this user journey PPT templates to present the statistics and elements of customer journey mapping. Showcase the six steps of customer journey mapping by employing this attention-grabbing customer life cycle PPT slideshow. Explain the information required in each stage of the customer journey with the user experience PPT slides. Showcase each stage of the customer mapping journey cycle by utilizing this user experience PPT infographics. Keep customer experience consistent across all the stages by showcasing channels used at each stage of the journey. Thus, improve the quality of your customer experience by downloading this ready to use experience journey PPT Presentation.
People who downloaded this PowerPoint presentation also viewed the following :
Content of this Powerpoint Presentation
Slide 1: This slide introduces the End User Journey Mapping. Add Your Company Name to begin.
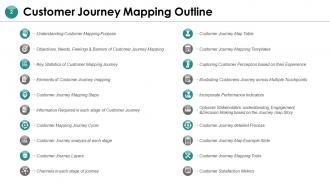
Slide 2: This slide shows the Customer Journey Mapping Outline- Understanding Customer Mapping Purpose, Objectives, Needs, Feelings & Barriers of Customer Journey Mapping, Key Statistics of Customer Mapping Journey, Elements of Customer Journey mapping, Customer Journey Mapping Steps, Information Required in each stage of Customer Journey, Customer Mapping Journey Cycle, Customer Journey analysis at each stage, Customer Journey Layers, Channels in each stage of journey, Customer Journey Map Table, Customer Journey Mapping Templates, Capturing Customer Perception based on their Experience, Illustrating Customers Journey across Multiple Touchpoints, Incorporate Performance Indicators, Optimize Stakeholders’ understanding, Engagement, &Decision-Making based on the Journey map Story, Customer Journey detailed Process, Customer Journey Map Example Slide, Customer Journey Mapping Tools, Customer Satisfaction Metrics.
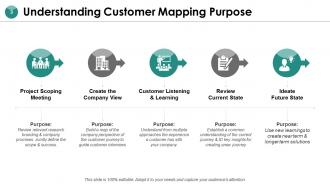
Slide 3: This slide unveils the Understanding Customer Mapping Purpose- Project Scoping Meeting, Create the Company View, Customer Listening & Learning, Review Current State, Ideate Future State.
Slide 4: This slide unveils the Objectives, Needs, Feelings & Barriers of Customer Journey Mapping.
Slide 5: This slide represents the Key Statistics of Customer Mapping Journey.
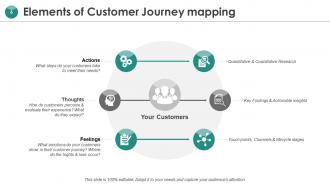
Slide 6: This slide represents the Elements of Customer Journey mapping such as- Actions, Thoughts and Feelings.
Slide 7: This slide represents the Customer Journey Mapping Steps like- Planning, Map Creation, Data Gathering, Identify & Analyze key findings & Actionable Insights, Investigate Issue & Opportunities, Present your findings & plan for continuous Improvement.
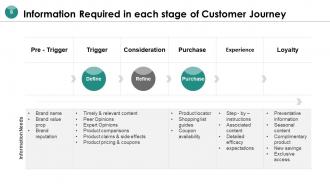
Slide 8: This slide showcases the Information Required in each stage of Customer Journey.
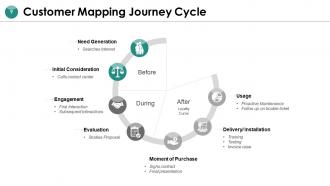
Slide 9: This slide showcases the Customer Mapping Journey Cycle- Moment of Purchase, Need Generation, Initial Consideration, Engagement, Evaluation, Delivery/ Installation, Usage.
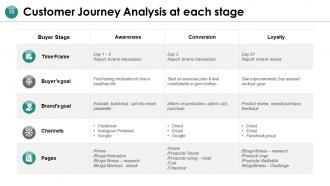
Slide 10: This slide portrays the Customer Journey Analysis at each stage.
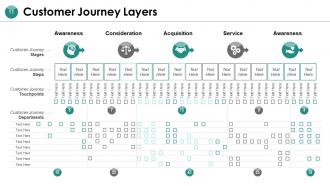
Slide 11: This slide portrays the Customer Journey Layers like- Awareness, Consideration, Acquisition, Service.
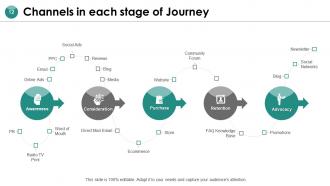
Slide 12: This slide unveils the Channels in each stage of Journey.
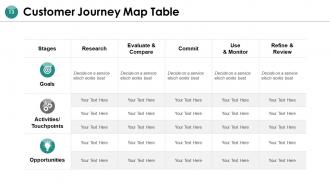
Slide 13: This slide unveils the Customer Journey Map Table.
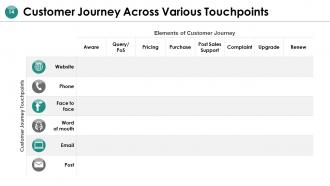
Slide 14: This slide unveils the Customer Journey Across Various Touchpoints.
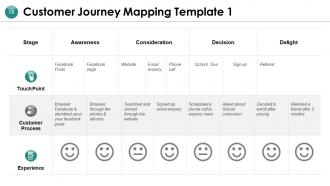
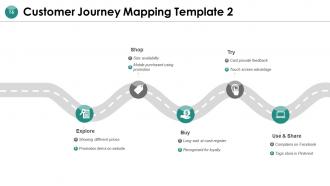
Slide 15: This slide presents the Customer Journey Mapping Template.
Slide 16: This slide presents the Customer Journey Mapping Template.
Slide 17: This slide shows Capturing Customer Perception based on their Experience like Terrible Experience, Poor Experience, Generic Experience, etc.
Slide 18: This slide shows Illustrating Customers Journey Across Multiple Touchpoints.
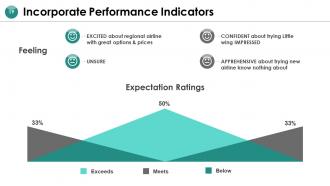
Slide 19: This slide depicts the Incorporate Performance Indicators.
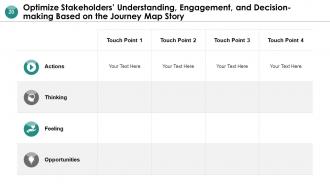
Slide 20: This slide depicts the Optimize Stakeholders’ Understanding, Engagement, and Decision-making Based on the Journey Map Story.
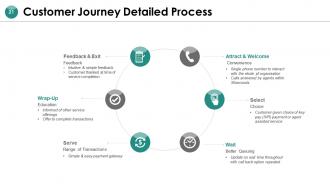
Slide 21: This slide depicts the Customer Journey Detailed Process that consists of- Attract & Welcome, Select, Wait, Feedback & Exit, Wrap-Up, Serve.
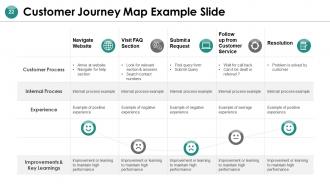
Slide 22: This slide presents the Customer Journey Map Example Slide.
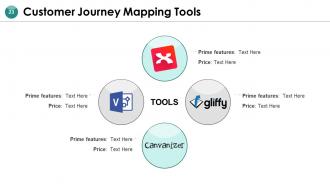
Slide 23: This slide presents the Customer Journey Mapping Tools.
Slide 24: This slide reveals the Customer Satisfaction Metrics- Average Reply Time, Replies Per Ticket, Average First Reply Time, Average Handle Time.
Slide 25: This is a coffee break slide that shows that work will be resumed after 15 minutes.
Slide 26: This templates contains an End User Journey Mapping Icons Slide.
Slide 27: This slide is named as Additional Slides for moving forward.
Slide 28: This slide contains an editable Line Chart showing the growth of two products.
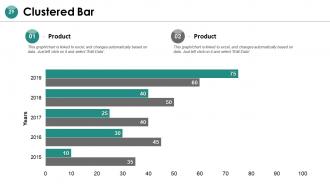
Slide 29: This slide contains a customizable Clustered Bar graph that depicts the market share of products.
Slide 30: This slide reveals Our Mission.
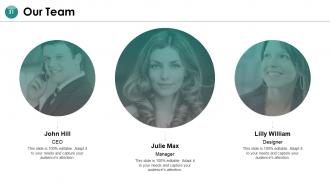
Slide 31: This slide reveals the names and designation of Our Team members.
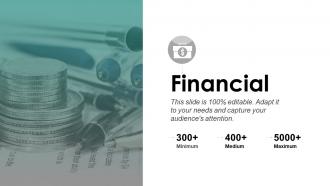
Slide 32: This slide shows the Financial information.
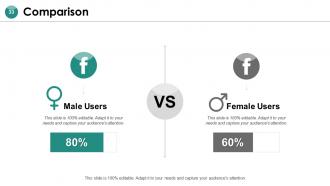
Slide 33: This slide presents a Comparison of male and female users.
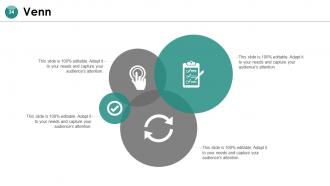
Slide 34: This slide contains Venn diagrams.
Slide 35: This slide contains a Quote by Roald Dahl.
Slide 36: This slide shows the Idea Generation.
Slide 37: This is a Thank You slide consisting of Address, contact number and email address.
End user journey mapping powerpoint presentation slides with all 37 slides:
Use our End User Journey Mapping Powerpoint Presentation Slides to effectively help you save your valuable time. They are readymade to fit into any presentation structure.












FAQs for End user journey mapping
It's basically about tracking every single interaction someone has with your product - from first hearing about it to actually using it and getting help when stuff breaks. You'll discover all these frustrating spots where people get stuck or confused (trust me, there's always more than you think). Pick one type of user first and follow their whole journey. Like, don't try to map everyone at once or you'll go crazy. The goal is finding where things suck so you can fix them. Pretty simple concept but weirdly helpful once you actually do it.
So end user journey mapping is way more tactical than regular customer journey stuff. Regular mapping covers everything - ads, research, buying, the whole nine yards. But end user mapping? You're literally watching how someone clicks through your actual product. Like, customer mapping might note "user researched competitors." End user mapping gets into the weedy details: "clicked login, error message popped up, tried forgot password three times." Way more granular. I'd start with your main user flows first. Map those out, then figure out where people are getting stuck or frustrated. It's honestly more useful than the high-level stuff sometimes.
So you'll want to map out what users are actually doing at each step, plus their emotions and pain points. Which platforms are they on? What's frustrating them? Focus on those critical moments that can make or break the experience - honestly, those are way more important than people think. Behind-the-scenes stuff your team does matters too, even when users can't see it. My take? Start basic and add details as you figure out how people really behave. Don't overthink the first version.
Think of it this way - personas give your journey maps actual people to design for instead of some vague "user." You're not mapping a generic person anymore, you're thinking about Sarah the swamped marketing manager or Jake who knows way too much about tech for his own good. This gets you super specific insights you'd totally miss otherwise. Your team stays on the same page about who you're actually building for too. Honestly, I'm that person who literally keeps the persona sheet next to my journey map so I can keep asking myself "wait, would Sarah really click this button here?" Makes such a difference.
Miro and Mural are your best bets - they're made for this kind of visual collaboration stuff. If your team's already on Figma for design work, that'll do the trick too. Lucidchart's solid if you want something more structured. But honestly? I've seen teams knock out great journey maps in basic PowerPoint when they're starting out. The tool really doesn't matter that much - what actually makes the difference is talking to real users throughout the whole thing. Oh, and Mural has these templates that can save you like an hour of setup time.
Track your conversion rates and see where people are dropping off - that's your bread and butter data. Customer satisfaction scores matter too, plus how many support tickets you're getting. Honestly, the best part is watching those annoying pain points actually disappear after you fix them. Don't forget to ask users directly through surveys what their experience was really like. Your maps need constant updates based on fresh data - they're not something you create once and forget about. Oh, and pick maybe 2-3 metrics that actually tie to what your business cares about. Otherwise you'll drown in data.
Oh man, don't just guess what users do - actually use real data. Focus on the main journey instead of mapping out every weird edge case (trust me on this one). Get your customer service and sales teams involved since they talk to users all day. Avoid making it super theoretical or complex. Keep it simple and based on what people actually experience. Short sentences work. Also, someone needs to own updating this thing regularly with fresh feedback, otherwise it'll just collect dust and become useless pretty quickly.
Honestly? Update them every 3-6 months or whenever you ship something big. I've watched so many teams build gorgeous journey maps then completely forget about them - such a waste! Treat them like living docs, not some one-and-done project. New features rolling out? Users complaining about specific steps? Time to refresh. Set a quarterly calendar reminder because trust me, you'll forget otherwise. Oh and if you're seeing weird behavior patterns in your analytics, that's probably the biggest red flag that your maps are getting stale.
Look, user feedback isn't optional - it's literally what makes your journey map worth anything. Without it, you're just guessing at what users actually do. I've watched teams spend weeks on gorgeous maps that were completely wrong because they never talked to real people. Pretty embarrassing honestly. Test everything you assumed about pain points and behaviors. Run interviews, usability tests, surveys - whatever gets you actual data. Then use what you learn to fix your map. The difference between what we think users experience vs. reality? Usually huge.
So journey mapping basically shows you where users hit walls or get lost using your product. The whole thing gives you their actual perspective - not what you *think* should happen, but what really does. Honestly, you'll probably cringe at how many pointless steps you've been making people jump through (I always do). Once you see these problem spots, you know what to fix first. Your team gets it too - they'll finally understand how frustrated users actually feel, not just the boring technical stuff. Just pick one main user flow and map it out this week.
Oh totally! Airbnb figured out their host onboarding was losing 40% of people halfway through - they mapped the whole thing, found the annoying parts, and fixed them. Spotify did something similar when new users were getting totally overwhelmed by all the music choices (honestly, relatable). They made the setup way simpler and engagement went up. Netflix is constantly tweaking their viewing flow to make recommendations better. The smart move all these companies made? They picked ONE user journey to focus on instead of trying to fix everything at once. Start with whatever's most broken for you.
So journey mapping is basically like getting x-ray vision for your product - you can suddenly see all the broken stuff that was hidden before. Map out every single step users take, and the pain points become super obvious. Things like confusing navigation or missing info that you totally missed will jump right out at you. Users get stuck, frustrated, or just bail at these spots. The visual format makes it way easier to spot where people are struggling. Oh, and definitely tackle the worst problems first - like the ones blocking critical tasks or hitting tons of users. Trust me, it works.
Honestly, you need data from everywhere to really nail this. Analytics show you where people bail out, but customer interviews? That's where the magic happens - they'll tell you exactly why they're frustrated. Your support team is sitting on a goldmine of complaints too. I'd also throw in some user testing sessions and heat maps. Oh, and don't forget social media - people love venting there. The trick is mixing hard numbers with actual human feedback. Otherwise you're just guessing what sucks about your product.
Get everyone who deals with customers in one room right from the start - marketing, sales, support, product, all of them. Have each team explain how they see the same customer touchpoint. Trust me, you'll be shocked at how different their perspectives are. I once watched teams debate onboarding for like an hour! But honestly, that's perfect because those gaps are exactly what needs fixing. Someone neutral should run it so people focus on what customers actually experience, not your internal stuff. That's when teams finally get that they're working on the same problem.
Tell the story instead of just dumping touchpoints on them. Walk them through each step like you're narrating a movie. Real user quotes work way better than generic pain points - executives eat that stuff up. Make it super visual with swim lanes showing which departments are involved (trust me on this one). Here's the thing though - don't just point out what's broken. Connect every insight to actual business impact and come with solutions ready. I've seen too many presentations that just complain without fixing anything. End with your top 3 recommendations ranked by priority. They need to walk out knowing exactly what to tackle first, otherwise you'll get crickets.
-
Innovative and Colorful designs.