


Flow Chart To Place An Online Order




Try Before you Buy Download Free Sample Product
 Impress Your
 Audience
 100%
100% Editable
 Save Hours
 of Time


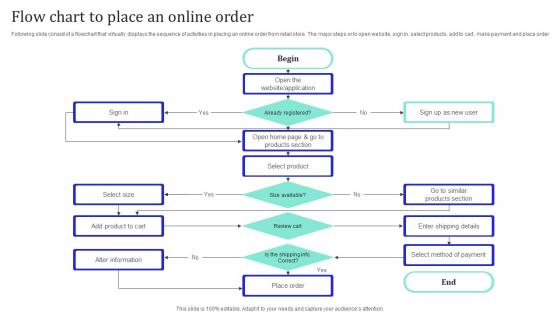
Following slide consist of a flowchart that virtually displays the sequence of activities in placing an online order from retail store. The major steps or to open website, sign in, select products, add to cart, make payment and place order.
People who downloaded this PowerPoint presentation also viewed the following :
Flow Chart To Place An Online Order with all 6 slides:
Use our Flow Chart To Place An Online Order to effectively help you save your valuable time. They are readymade to fit into any presentation structure.





FAQs for Flow Chart To Place
Key components of an effective flow chart include clear start and end points, standardized symbols, logical decision points, directional arrows, and concise labeling. These elements work together by ensuring seamless navigation, eliminating confusion, and enabling quick process understanding, with many organizations finding that well-structured flow charts significantly enhance operational efficiency and team communication.
Flow charts enhance understanding in complex processes by breaking down intricate workflows into visual, step-by-step sequences that eliminate confusion and highlight decision points, dependencies, and potential bottlenecks. Through clear visual mapping, organizations streamline training, improve process documentation, and enable faster problem-solving, with many finding that visual representations reduce onboarding time and enhance operational efficiency significantly.
Microsoft Visio, Lucidchart, Draw.io, Creately, and SmartDraw are among the most effective flowchart software tools available today. These platforms streamline diagram creation through intuitive drag-and-drop interfaces, collaborative features, and extensive template libraries, with many organizations finding that cloud-based solutions like Lucidchart enhance team productivity and workflow documentation across departments.
Flow charts are extensively utilized across healthcare for patient care protocols, manufacturing for production processes, finance for loan approvals and compliance, software development for system design, and logistics for supply chain management. These visual tools streamline complex workflows by standardizing procedures, reducing errors, and improving training efficiency, with many organizations finding that systematic process mapping ultimately delivers faster decision-making and enhanced operational transparency.
Flow charts excel at showing sequential processes and decision points with clear directional flow, while mind maps emphasize brainstorming and hierarchical relationships through radial, non-linear structures. While flow charts streamline operational workflows, quality control processes, and system troubleshooting across manufacturing and healthcare sectors, mind maps enhance creative planning and knowledge organization, with many organizations finding that combining both techniques delivers comprehensive project visualization and strategic process optimization.
Best practices for designing visually appealing flow charts include using consistent shapes and colors, maintaining clear directional flow, incorporating adequate white space, selecting readable fonts, and establishing logical hierarchies. These design principles streamline comprehension by reducing cognitive load, enhancing visual consistency, and improving information retention, with many organizations finding that well-designed flow charts significantly accelerate training processes and operational understanding.
Flow charts aid project management by visualizing workflows, identifying dependencies, mapping critical paths, and highlighting potential bottlenecks before they occur. Through strategic visual planning, project managers streamline resource allocation, enhance team coordination, and accelerate decision-making processes, with many organizations finding that clear workflow visualization ultimately delivers improved project timelines and stakeholder communication.
Flow charts serve as foundational diagnostic and optimization tools in Lean and Six Sigma by visually mapping current processes, identifying waste, bottlenecks, and inefficiencies. These methodologies leverage flow charts to standardize workflows, eliminate non-value-added steps, and measure improvement outcomes, with manufacturing and healthcare organizations finding that visual process mapping accelerates problem-solving and sustainable operational enhancements.
Ensuring clarity and conciseness in flow charts involves using simple language, consistent symbols, logical sequencing, minimal text per box, and clear directional arrows. These design principles streamline complex processes by eliminating unnecessary details, maintaining visual hierarchy, and creating intuitive pathways, ultimately delivering enhanced comprehension and faster decision-making for teams across organizations.
Common pitfalls include overcomplicating processes with unnecessary steps, using inconsistent symbols, creating unclear decision points, omitting alternative paths, and failing to define start/end points clearly. These issues often result in confusing workflows that hinder rather than enhance understanding, with many organizations finding that simple, standardized approaches deliver better communication and operational efficiency.
Flow charts facilitate communication by creating visual roadmaps that translate complex processes into easily understood diagrams, eliminating confusion and ensuring everyone shares the same understanding. These visual tools enable teams to identify bottlenecks, streamline workflows, and coordinate efforts more effectively, with many organizations finding that standardized flow charts reduce miscommunication and accelerate project timelines significantly.
Horizontal flow charts display processes from left to right, making them ideal for linear workflows, timelines, and decision trees, while vertical flow charts flow top to bottom, better suited for hierarchical structures, organizational charts, and complex multi-level processes. Organizations typically choose horizontal formats for project management and process documentation, with vertical layouts preferred for reporting structures and system architectures, ultimately delivering clearer communication based on content complexity.
Integrate flow charts into presentations by placing them strategically at decision points, using consistent visual branding, and animating step-by-step reveals to guide audience attention. These visual tools enhance comprehension by breaking complex processes into digestible segments, with many organizations finding that well-designed flow charts reduce presentation time while improving stakeholder understanding and decision-making outcomes.
Successful flowchart applications include hospital patient triage systems, manufacturing quality control processes, software debugging protocols, customer service escalation procedures, and financial loan approval workflows. These visual mapping tools streamline operations by reducing decision-making time, minimizing errors, and ensuring consistent processes, with many organizations finding that standardized flowcharts ultimately enhance operational efficiency and employee training effectiveness.
Online collaboration tools enhance flow chart creation through real-time editing, cloud-based storage, automated version control, instant sharing capabilities, and integrated feedback systems. These platforms enable teams to simultaneously develop process maps, streamline workflow documentation, and accelerate decision-making across departments, with many organizations finding that collaborative flow charting reduces project timelines while improving cross-functional alignment.
-
Helpful product design for delivering presentation.
-
Professional and unique presentations.