


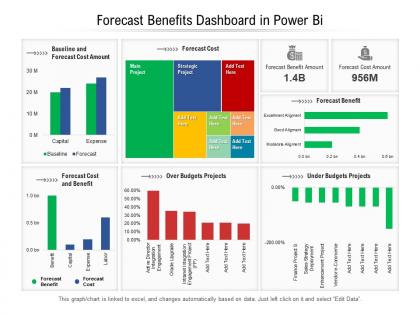
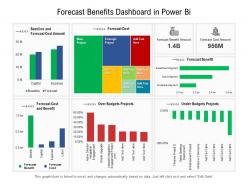
Forecast benefits dashboard in power bi




Try Before you Buy Download Free Sample Product
 Impress Your
 Audience
 100%
100% Editable
 Save Hours
 of Time


Our Forecast Benefits Dashboard In Power Bi are topically designed to provide an attractive backdrop to any subject. Use them to look like a presentation pro.
People who downloaded this PowerPoint presentation also viewed the following :
Forecast benefits dashboard in power bi with all 2 slides:
Use our Forecast Benefits Dashboard In Power Bi to effectively help you save your valuable time. They are readymade to fit into any presentation structure.
FAQs for Forecast benefits dashboard
Honestly, it depends on your data but I'd go with time series analysis first - great for spotting historical trends. Regression models help you understand how variables connect. Moving averages are solid for short-term predictions, exponential smoothing handles seasonal stuff better. Random forests and ML are trendy right now but kinda overkill unless you've got complex data. Don't ignore the basics either - expert judgment and market research still matter. Start simple, test a few methods, then see what actually works. Oh, and definitely compare your forecasts to real results after. That's how you'll know what clicks for your business.
Look, historical data is literally everything when it comes to forecasting. You need solid patterns to work with - seasonal stuff, trends, weird outliers that tell a story. More quality data = better predictions, simple as that. But here's the thing I wish someone told me earlier: crappy data will completely screw your forecasts. Been there! Clean your data first before getting fancy with models. Make sure it goes back far enough to actually capture cycles that matter. Oh, and audit what you've got now - you'd be surprised how messy most datasets are.
Dude, forecasting has completely changed with all this tech stuff. Machine learning can crunch through data so much faster than the old methods - honestly kind of crazy how quick it is. AI spots patterns we'd never catch, and cloud computing means you don't need some massive computer setup. Real-time data keeps everything current instead of your predictions going stale after like a week. The automation part is pretty sweet too since it just updates itself. I was skeptical at first but even basic ML tools will surprise you. Worth checking out if you're still doing everything manually.
Honestly, don't pick one - use both. Quantitative models give you that solid baseline and catch patterns you'd totally miss otherwise. But here's the thing - then you gotta layer in the qualitative stuff from your sales team, customer feedback, all that ground-level intel. I've watched so many forecasts completely bomb because they just relied on historical data when everything was changing. The magic happens when you start with your quant foundation, then get your cross-functional teams to actually challenge those numbers based on what they're seeing out there. Regular forecast reviews where analysts and business people can duke it out? That's where you'll find the real insights.
Dude, don't overfit to old data - that's the classic mistake. External stuff can wreck your model overnight. Watch out for those ridiculous hockey stick projections too (seriously, why does everyone think revenue will just magically explode?). Seasonality matters more than people think. Stop tweaking your model every time there's a weird data point - that's just noise. Oh, and never let a committee build your actual model. Nightmare territory. Keep things simple, write down what you assumed, and definitely run different scenarios. You'll thank yourself later when something unexpected happens.
Look, it really depends on what kind of business you're dealing with. Finance folks are obsessed with predicting market swings and risk - they use crazy complex models with like a million variables. Healthcare is probably the most intense since they're forecasting patient loads and disease outbreaks (literally life or death stuff). Retail's more straightforward - just demand planning and figuring out seasonal trends. The big difference is timing though. Financial analysts might forecast daily changes while retailers are planning inventory months out. Oh, and your data sources are totally different too. Just pick whatever method actually moves the needle for your specific situation.
Look at what data you're working with first. Small datasets? Simple models are totally fine. Tons of historical data? That's when fancier algorithms actually pay off. Check if you've got seasonal patterns or stable trends - makes a huge difference in what'll work. Short-term vs long-term forecasting needs different approaches too. Honestly, I've seen people obsess over perfect accuracy when "good enough" would've saved them weeks of headache. Your computer specs matter more than you'd think, and don't forget stakeholders need to actually understand your results. Start basic, then get fancy only if it actually helps.
So basically, scenario planning stops you from betting everything on one forecast. You create like 3-4 different versions of what could happen - best case, worst case, and some realistic middle grounds. Honestly, it's saved my ass more times than I can count because weird stuff always happens, right? Pick the biggest uncertainties in your situation first, then build stories around how each one might go sideways or work out great. It forces you to catch assumptions you didn't even realize you were making. Way better than crossing your fingers and hoping your single prediction holds up.
Honestly, the biggest thing is getting everyone in the same room regularly - sales, finance, ops, whoever. Make sure they're all looking at the same dashboards because I've seen teams argue for hours over different data sets (such a waste of time). Document your assumptions somewhere shared so you're not explaining the same methodology every week. Each team needs clear ownership of their piece, but here's the key - pick one person to be the tie-breaker when forecasts don't match up. Trust me, conflicts will happen and someone's gotta make the final call.
Look, economic indicators are basically your crystal ball for forecasting. GDP growth, unemployment, consumer confidence - they all hint at where demand's headed. You can't just ignore this stuff and expect accurate predictions, right? It's like... I dunno, trying to plan a picnic without checking the weather forecast. Pick maybe 2-3 indicators that actually match up with your business historically. I'd honestly start there rather than drowning in every single data point out there. Build those into your models and you'll see way better results.
So machine learning basically finds patterns in your data that you'd never catch yourself - it's wild how much it picks up on. The algorithms can handle huge datasets and weird relationships between variables that mess up traditional forecasting. What's cool is they keep learning as new data rolls in, so they actually get better over time. They cut out human bias too, which is honestly a bigger problem than most people realize. Ensemble methods are where it gets interesting though - they combine different algorithms and the accuracy jumps up significantly. I'd say start simple, run an ML model next to whatever you're doing now and just compare them for a few months.
Oh man, this is huge - you'll tank your forecasts if you ignore seasonality and cycles. Think holiday shopping spikes or AC usage in summer, that's seasonality happening at regular intervals. Cycles are the longer-term stuff without fixed timing. Honestly can't tell you how many people mess this up right off the bat. Plot your data first and just eyeball it for obvious patterns. Your model has to separate this stuff from the actual trend, otherwise you're basically guessing. Trust me on this one.
Honestly, you've gotta start with buffers and backup plans baked right in. Don't put all your trust in one forecasting method - mixing a few different approaches together works way better. Keep checking how accurate you're being so you catch when things start going off track. Plan out your best and worst case scenarios, not just the middle ground stuff. Oh, and this is huge - make sure your supply chain and finances can actually handle it when you're wrong (because you will be sometimes). I'd also track your mistakes over time. You'll probably spot some patterns in where you keep screwing up that you can actually fix.
So bias is huge - your models can totally screw over certain groups if you're not careful. I always audit my data sources first. Oh and don't present forecasts like they're facts when they're basically educated guesses (I'm guilty of this too sometimes). Be upfront about uncertainty and limitations. Think about who gets hurt if you're wrong - that's honestly the most important question. Document everything so people can call out your methodology if needed. Before you start, ask yourself who benefits versus who might get screwed over.
Hey! So when you're presenting forecasts, hit these three things: give context, show confidence ranges, and wrap up with clear actions. Your stakeholders need to understand what assumptions you made and what might throw off the numbers - trust me, they'll be pissed if reality goes sideways later. Skip the single-point estimates and use ranges instead. Nobody's that good at predicting the future, right? Keep visuals simple and ditch analyst-speak that'll confuse people. Oh, and always end with specific decisions they need to make based on your forecast.
-
Good research work and creative work done on every template.
-
Great product with highly impressive and engaging designs.