


Key benefits of data analytics tools


Try Before you Buy Download Free Sample Product
 Impress Your
 Audience
Editable
of Time


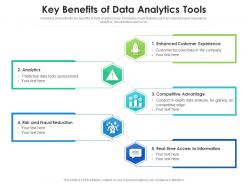
Data analytics tools are becoming an increasingly important part of business operations. These tools help organizations collect, process, and analyze data to improve decision-making. Here are four key benefits of data analytics tools. The first benefit is that data analytics helps organizations reduce costs. By analyzing data, businesses can find ways to become more efficient and save money. The second benefit is that data analytics improves communication. The bottom line is that data analytics tools are a powerful way to gain insights into your business. And, with SlideTeam’s templates, you can get the most out of these tools by creating stunning presentations that will help convince your team and stakeholders of the value of data-driven decision making. So don’t wait any longer! Download our templates today and start gaining deep insights into your business performance.
People who downloaded this PowerPoint presentation also viewed the following :
Key benefits of data analytics tools with all 2 slides:
Use our Key Benefits Of Data Analytics Tools to effectively help you save your valuable time. They are readymade to fit into any presentation structure.
FAQs for Key benefits of
Key features include real-time data processing, advanced visualization capabilities, machine learning integration, automated reporting, and seamless database connectivity. These technologies streamline decision-making by transforming complex datasets into actionable insights, enabling predictive modeling, and delivering comprehensive dashboards, with many organizations finding that strategic analytics ultimately enhances operational efficiency and competitive advantage.
Data analytics tools vary significantly in user interface design and accessibility, with platforms like Tableau and Power BI offering intuitive drag-and-drop interfaces, while tools like R and Python require programming knowledge. Many organizations find that cloud-based solutions like Google Analytics and Microsoft Azure provide seamless accessibility across devices, ultimately enabling broader team adoption and faster decision-making processes.
Data visualization capabilities transform raw analytical outputs into accessible insights through interactive dashboards, charts, graphs, heat maps, and real-time displays that enable rapid pattern recognition. These visual elements streamline decision-making across organizations by making complex data interpretable for stakeholders, with many financial services and retail companies finding that enhanced visualization ultimately delivers faster strategic responses and improved operational efficiency.
Organizations can determine the best data analytics tool by evaluating industry-specific requirements, data complexity, integration capabilities, scalability needs, and budget constraints. Healthcare systems prioritize HIPAA compliance and patient data security, while retail companies focus on real-time customer behavior analysis, with many finding that pilot testing multiple platforms ultimately delivers the most informed decision-making process.
Common data sources integrated with analytics tools include databases, cloud storage platforms, APIs, spreadsheets, and streaming data feeds. These integrations streamline data collection by connecting systems like CRM platforms, social media APIs, and IoT sensors, with many organizations finding that automated data pipelines significantly enhance operational efficiency and decision-making capabilities.
Machine learning features enhance data-driven decision-making by automating pattern recognition, predicting future trends, and identifying anomalies that humans might miss. These capabilities enable organizations to process vast datasets more efficiently, deliver real-time insights for faster strategic responses, and ultimately gain competitive advantages through more accurate forecasting and optimized resource allocation.
Cloud-based data analytics platforms require robust security measures including data encryption, access controls, compliance monitoring, network security protocols, and backup systems. These safeguards protect sensitive information by securing data transmission, restricting unauthorized access, and ensuring regulatory compliance, with many financial services and healthcare organizations finding that comprehensive security frameworks ultimately deliver enhanced data protection and operational confidence.
Businesses leverage data analytics tools to improve operational efficiency by identifying bottlenecks, optimizing resource allocation, predicting maintenance needs, and automating routine processes. Through predictive analytics and real-time monitoring, organizations in manufacturing, logistics, and retail streamline workflows, reduce waste, and enhance productivity, ultimately delivering faster operations and significant cost reductions.
Real-time data analysis enables businesses to make immediate, informed decisions by processing information as it occurs, responding instantly to market changes, customer behaviors, and operational issues. This capability delivers significant competitive advantages through faster problem resolution, enhanced customer experiences, and proactive risk management, with many organizations finding that real-time insights ultimately streamline operations and accelerate growth opportunities.
Data analytics tools support predictive analytics by processing historical data, identifying patterns through machine learning algorithms, and generating statistical models for future trend forecasting. These platforms enable organizations to anticipate customer behavior, optimize inventory management, and predict market fluctuations, with many retail and financial services companies finding that predictive insights significantly enhance strategic decision-making and competitive positioning.
Small enterprises typically face higher per-user costs but lower total expenditure, often favoring cloud-based solutions like Tableau or Power BI, while large enterprises benefit from volume discounts and custom enterprise packages. Large organizations can absorb substantial upfront investments in platforms like SAS or Oracle, ultimately achieving lower per-user costs through economies of scale and strategic negotiations.
Data analytics tools facilitate collaboration by providing shared dashboards, standardized reporting frameworks, and unified data visualization platforms that both IT and business teams can access and interpret. These platforms streamline communication through automated insights, self-service analytics capabilities, and collaborative workspaces, ultimately enabling faster decision-making and strategic alignment across departments.
Best practices for implementing a new data analytics tool include defining clear objectives, ensuring data quality, providing comprehensive training, establishing governance protocols, and planning phased rollouts. These approaches streamline adoption by aligning stakeholder expectations, minimizing integration challenges, and maximizing user engagement, with many organizations finding that structured implementation ultimately delivers faster insights, improved decision-making capabilities, and stronger competitive advantage.
Open-source data analytics tools offer cost-effectiveness, customization flexibility, and community support, while proprietary solutions provide dedicated technical support, integrated features, and enterprise-level security. Many organizations find that open-source tools like R and Python excel for specialized analysis and experimentation, while proprietary platforms deliver streamlined implementation, comprehensive warranties, and seamless scalability for large-scale operations.
Organizations should track ROI through cost savings and revenue growth, time-to-insight improvements, data accuracy rates, user adoption across departments, and decision-making speed enhancements. These metrics enable businesses to measure operational efficiency gains, competitive advantages, and strategic outcomes, with many enterprises finding that tracking both quantitative results and qualitative improvements delivers comprehensive investment validation.
-
Best Representation of topics, really appreciable.
-
Great product with effective design. Helped a lot in our corporate presentations. Easy to edit and stunning visuals.
-
Use of icon with content is very relateable, informative and appealing.
-
Great designs, really helpful.
-
Designs have enough space to add content.
-
Awesomely designed templates, Easy to understand.
-
Use of different colors is good. It's simple and attractive.
-
Easily Editable.