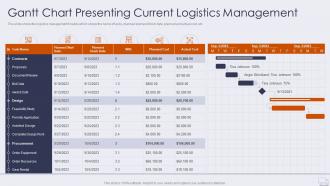
Gantt chart presenting current logistics improving logistics management operations
Try Before you Buy Download Free Sample Product
Audience
Editable
of Time
This slide shows the logistics management timeline which shows the name of tasks, planned start and finish date, planned and actual cost, etc.
People who downloaded this PowerPoint presentation also viewed the following :
Gantt chart presenting current logistics improving logistics management operations with all 6 slides:
Use our Gantt Chart Presenting Current Logistics Improving Logistics Management Operations to effectively help you save your valuable time. They are readymade to fit into any presentation structure.
FAQs for Gantt chart presenting current logistics improving
You'll need task names, dates, dependencies, resource assignments, and progress tracking. Start with major milestones then drill down into details later. Show everything from procurement through delivery - trust me, this stuff gets chaotic without proper planning. Buffer time is crucial since trucks break down and shipments always get delayed (Murphy's law and all that). Make your critical path super obvious so everyone knows what absolutely can't slip. Dependencies are where most people mess up, so map those out carefully. Keep it simple at first or you'll drive yourself crazy.
Honestly, Gantt charts are game-changers for logistics teams. No more "wait, where's that shipment?" emails flooding your inbox. Everyone can actually see what's happening and who's doing what. Think of it like a roadmap that makes sense to everyone - warehouse guys, drivers, customer service, the whole crew. You'll catch problems before they blow up into disasters. And when stuff inevitably goes sideways (which it always does), you can show people exactly how one delay screws up everything else. Just get a dashboard everyone can check in real-time. Trust me on this one.
Honestly, real-time updates are gonna be your biggest headache. When shipments get delayed or routes change last minute, your pretty timeline just falls apart. Weather alone will mess you up more than you think! Managing all those moving pieces - drivers, warehouses, customs delays - creates this web of dependencies that's nightmare fuel. If you're juggling hundreds of shipments? Good luck with that scale. Start with something small first, like a pilot run. Get software that actually talks to your current systems so updates happen automatically. Trust me on this one.
So Gantt charts basically show you a visual timeline of everything happening in your supply chain. Pretty neat stuff - you can spot bottlenecks before they wreck your whole operation. All your procurement deadlines, shipping schedules, whatever, it's right there in one view. The best part? You'll see how tasks connect to each other. Like when your supplier screws up and delays materials, boom - you instantly know how that ripples through production and delivery. I swear by them for keeping stakeholders in the loop about realistic timelines too.
Yeah, most Gantt chart tools play nice with logistics software these days. You can hook them up through APIs or just import/export data - whatever works. Monday.com and Smartsheet already have connectors built in for the popular logistics platforms, which saves you a headache. The real magic happens when data syncs both ways though. Like when your delivery schedule gets messed up in the TMS, your Gantt automatically updates too. I'd start by seeing what integrations your current setup already supports - might be easier than you think.
Start with your critical path - figure out how procurement, warehousing, transport, and delivery connect. I'd break big shipments into smaller chunks so you catch problems early. Trust me, learned that lesson on a nightmare multi-modal job last year. Color-coding helps a ton - do it by transport type or region. Buffer time is your friend for customs headaches, weather, carrier drama. Update weekly with real progress, not just wishful thinking. Oh, and actually share the thing with everyone involved. Sounds obvious but you'd be surprised how many people skip that step.
Dude, Gantt charts are clutch for this stuff. They show you exactly when you need warehouse staff, trucks, whatever - and for how long. No more scrambling for drivers at the last second because you forgot about that big shipment. The visual makes it super obvious when things overlap or conflict. During busy seasons? Total game changer. You'll spot bottlenecks before they wreck your day and can move people around accordingly. I learned this the hard way last year, honestly. Plus you can see those dead periods where teams are just sitting around - perfect time to squeeze in other tasks.
Honestly, Gantt charts are pretty solid for tracking logistics stuff. The main thing you'll want to watch is schedule adherence - like are your deliveries actually hitting those planned dates? Resource utilization rates matter too, plus you can spot bottlenecks way easier than with regular spreadsheets. Lead times become super obvious, which is clutch. Milestone completion percentages are helpful if you're into that level of detail. Oh, and if you add budget data, cost variances pop right out. I'd probably start with your most critical delivery deadlines first - that's where you'll see the biggest impact anyway.
Honestly, Gantt charts are great for catching logistics problems early. When you map everything out visually, it's easy to spot where delays will screw you over downstream. I always look for those scary single points of failure first - like when you're totally dependent on one supplier. Color-code the risky stuff so it stands out during reviews. You can even add backup plans right on the chart, which is pretty handy. The timeline thing really helps too because you'll see when tasks are crammed together with zero buffer time. Trust me, that visual makes risk patterns way more obvious than spreadsheets.
Honestly, Gantt charts are perfect for logistics stuff. You'll see everything at once - which tasks depend on others, where your resources are going, timeline conflicts. Way clearer than Kanban boards or spreadsheets for complex shipping projects. I know they look intimidating at first, but they're actually super helpful for catching bottlenecks before they screw up your deliveries. Plus your boss will love how easy it is to understand the timeline without getting into project management weeds. Map out your next big multi-modal shipment on one and I guarantee you'll spot issues you totally missed before.
Honestly, dig into your old project data - it's a game changer. People always lowball their estimates (myself included lol). Pull up the last 6 months and see where things actually went sideways - customs delays, weather, suppliers being flaky, whatever. Those real numbers should go straight into your Gantt chart instead of wishful thinking. Seasonal stuff matters too. Once you spot the patterns, build in buffers based on actual variance, not what sounds reasonable. Keep updating your templates with fresh data though, or you'll just be working with outdated assumptions again.
Honestly, the AI stuff is wild - it actually predicts when things'll go wrong before they happen and adjusts your timeline automatically. IoT sensors are feeding live data straight from trucks and warehouses into your charts, which is kinda mesmerizing to watch. Cloud platforms let everyone collaborate instantly. Mobile apps mean you can update from literally anywhere (even the bathroom, not that I'm judging). The best part? Everything integrates with your existing logistics software now, so no more switching between ten different tabs. I'd probably start with an AI-powered one first and see how it goes.
Dude, Gantt charts are seriously clutch for supply chain disasters. When something goes sideways, you can immediately spot which delays will domino into other stuff. It's like having a visual map of your whole process - touch one piece and boom, you see exactly what gets pushed back downstream. The cool part? You can drag tasks around to test different fixes, like switching suppliers or rerouting shipments. Way better than telling your boss "yeah we're behind" with zero details, right? I'd map out your current supply chain as a Gantt now so you're not scrambling when things inevitably blow up. Trust me on this one.
Honestly, Gantt charts saved my butt when I was running three projects simultaneously last year. They let you see everything laid out visually - timelines, where resources overlap, which tasks depend on others. Way better than juggling spreadsheets. Picture this: you're doing warehouse upgrades AND fleet rollouts at the same time. The chart shows you exactly where they'll clash so you can plan around it. Plus stakeholders love them because they don't have to decode tons of data. Start with your biggest 3-4 projects on one chart. You'll spot conflicts immediately and can shuffle things before they become headaches.
Honestly, just throw them into hands-on workshops right away. Have them build actual Gantt charts using your real logistics projects - way better than boring generic examples. Focus on the basics first: mapping dependencies between shipping, warehousing, delivery tasks. Critical path stuff is huge since that's where most delays bite you. Then practice updating charts when chaos hits (and it will) - trucks breaking down, delayed shipments, all that fun stuff. Oh, and definitely give everyone template access. Weekly team reviews become second nature pretty quick. Trust me, people learn this way faster when they're working with scenarios they actually recognize from their daily grind.
-
Graphics are very appealing to eyes.
-
Best way of representation of the topic.