


Gap analysis powerpoint presentation with slides





Try Before you Buy Download Free Sample Product
 Impress Your
 Audience
 100%
100% Editable
 Save Hours
 of Time


Crafting a fruitful good example of PPT on gap analysis can be a challenge on your own. To help you out here we are showcasing complete PowerPoint slide deck to pictorially illustrate a gap analysis process or gap analysis model. Well applicable to all businesses it acts as a potential tool to figure out the priorities required for carrying improvement. Most exciting thing is that you can also apply our ready made PPT model to compare the performance of your employees so as to quantify the disparity between their current and desired performance. Furthermore, a visual communication made with help of our presentation deck helps to empower employees for quick diagnosis of a problem. Additionally, to cover all the necessary aspects here we have included template themes like gap analysis graphs, basic gap analysis chart, gap analysis procedure etc. In short, you can add value to your business processes by thoroughly discussing a business gap analysis with help of our readymade sample presentation PPT. So, hurry download our performance gap analysis PPT sample file and get started immediately. Avoid excessive formality with our Gap Analysis Complete Powerpoint Deck With Slides. Allow greater freedom to exist.
People who downloaded this PowerPoint presentation also viewed the following :
Content of this Powerpoint Presentation
Slide 1: This slide introduces Gap Analysis. State Your company name and get started.
Slide 2: This is an Agenda slide. State your agendas here.
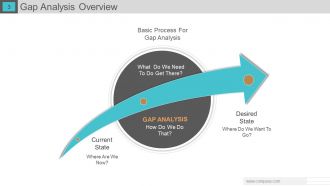
Slide 3: This slide presents a Gap Analysis Overview with the following points- Basic Process For Gap Analysis, Current State, Desired State, Where Do We Want To Go? How Do We Do That? What Do We Need To Do Get There? Where Are We Now?
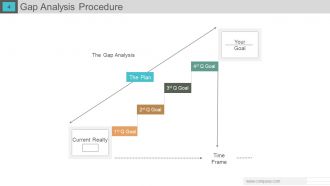
Slide 4: This slide showcases the Gap Analysis Procedure with- Time Frame, The Gap Analysis, Your Goal, Current Realty.
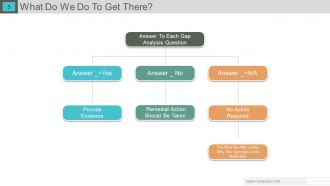
Slide 5: This slide presents What Do We Do To Get There?
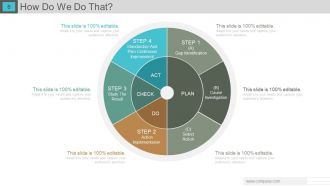
Slide 6: This slide presents How Do We Do That?
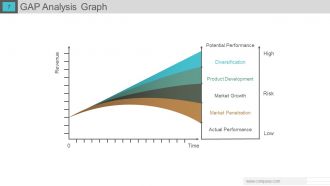
Slide 7: This slide showcases a GAP Analysis Graph with- Actual Performance Potential Performance Diversification Product Development Market Growth Market Penetration Revenue in terms of Time, Low-High Risk.
Slide 8: This slide shows Current State Analysis Company's Mission stating Our Mission.
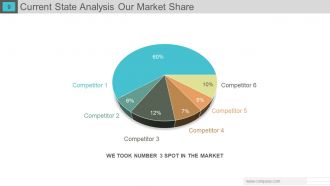
Slide 9: This slide showcases the Current State Analysis Our Market Share in pie chart form.
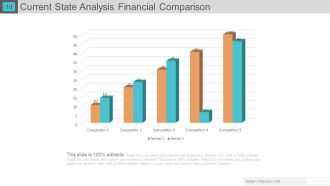
Slide 10: This slide shows Current State Analysis Financial Comparison graph.
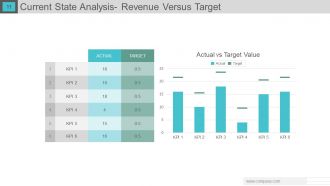
Slide 11: This slide shows Current State Analysis- Revenue Versus Target with separate graphs of- Actual vs Target Value, Actual - Target
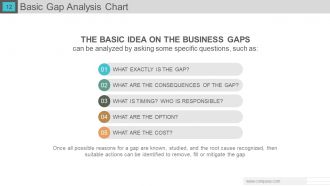
Slide 12: This slide showcases Basic Gap Analysis Chart with the follwoing points- What Exactly is The Gap? What are the Comsequences of the Gap? What is Timing? who is Responsible? What are the Options? What are The Cost?
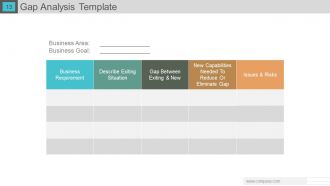
Slide 13: This slide presents a Gap Analysis Template with- Business Area, Business Goal.
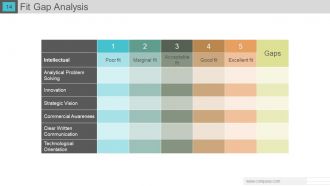
Slide 14: This slide presents a Fit Gap Analysis table.
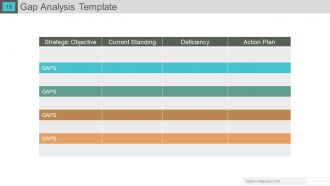
Slide 15: This slide shows a Gap Analysis Template.
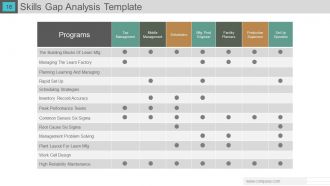
Slide 16: This slide shows a Skill Gap Analysis Template.
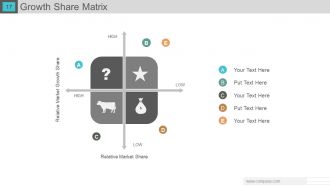
Slide 17: This slide shows a Growth Share Matrix to display infromation, specification etc.
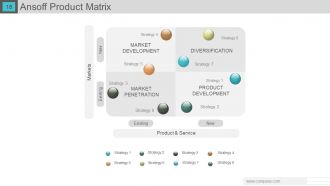
Slide 18: This slide showcases an Ansoff Product Matrix with- Product & Service, New, Existing, Market Development, Market Penetration, Diversification, Product Development.
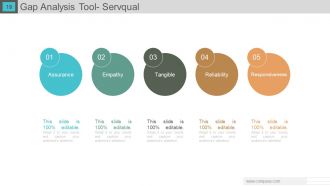
Slide 19: This slide presents Gap Analysis Tool- Servqual with the following points- Assurance, Empathy, Tangible, Reliability, Responsiveness.
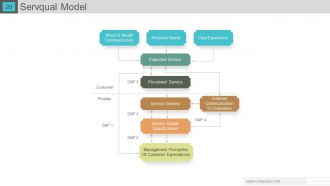
Slide 20: This slide presents a Servqual Model with the following points- Word Of Mouth Communication, Management Perception Of Customer Expectations, Personal Needs, Past Experience, Perceived Service, Service Delivery, Service Quality Specifications, External Communication To Customers, Expected Service, Customer, Provider, GAPS.
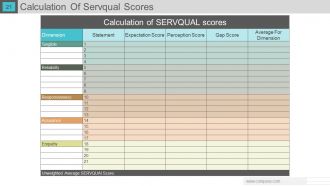
Slide 21: This slide presents Calculation Of Servqual Scores table.
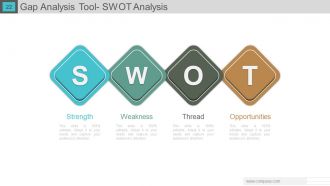
Slide 22: This slide showcases Gap Analysis Tool- SWOT Analysis.
Slide 23: This slide presents Gap Analysis Tool- Fishbone Analysis 6 Ms. They are- Machinery, Manpower, Method, Material, Maintenance, Mother Nature Effect.
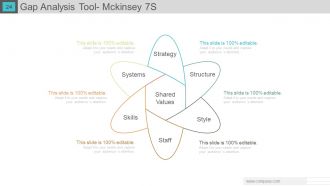
Slide 24: This slide presents Gap Analysis Tool- Mckinsey 7S. They are- Shared Values, Strategy, Structure, Style, Staff, Skills, Systems.
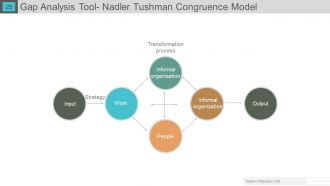
Slide 25: This slide showcases Gap Analysis Tool- Nadler Tushman Congruence Model. The constituents are- Work, Informal organization, People, Strategy, Output, Input, Transformation process.
Slide 26: This slide is titled Additional Slides to move forward. You can change the content as per need.
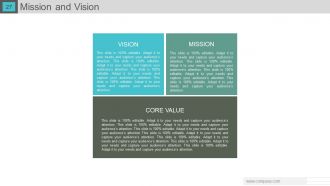
Slide 27: This slide presents Mission and Vision showing Vision, Mission and Core Value.
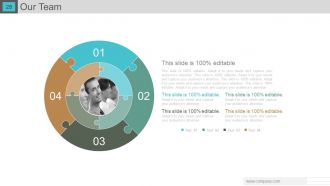
Slide 28: This is an Our Team slide as puzzle image box with text boxes.
Slide 29: This is an About Us slide. State company/team specifications here.
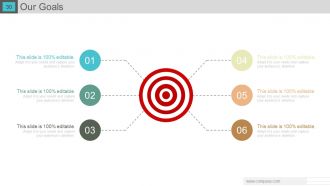
Slide 30: This is Our Goals slide. State goals, targets etc. here.
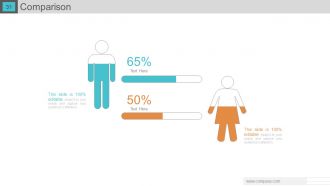
Slide 31: This is a Comparison slide to compare two entities etc.
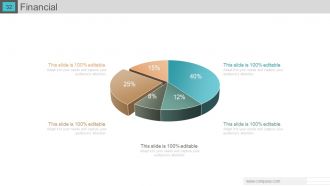
Slide 32: This is a Financial score slide. State financial aspects etc. here.
Slide 33: This is a Quotes slide to convey company/organization message, beliefs etc.
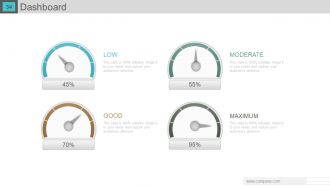
Slide 34: This is a Dashboard slide to show growth factors in terms of Good, Low, Maximum and Moderate.
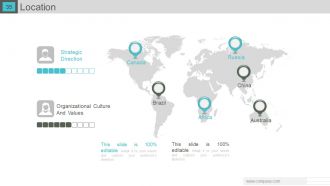
Slide 35: This is a Location slide of world map to show global presence, growth etc.
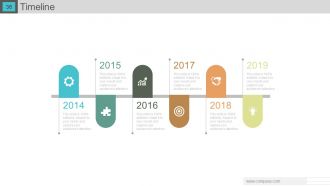
Slide 36: This is a Timeline slide to show growth, highlighting factors, milestones etc.
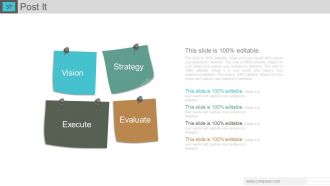
Slide 37: This is a Post It slide to show - Evaluate, Strategy, Vision, Execute.
Slide 38: This is a News Paper slide to show events, news etc. You can change the slide as per your need/requirement.
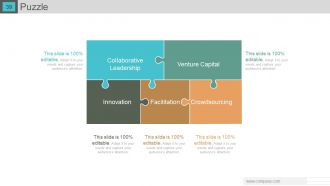
Slide 39: This is a Puzzle image slide showing- Collaborative Leadership, Venture, Facilitation, Innovation, Crowdsourcing.
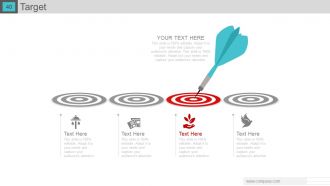
Slide 40: This is a Target slide. State targets, goals etc. here.
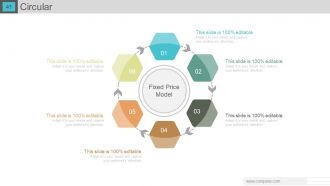
Slide 41: This is a Circular image slide showing Fixed Price Model.
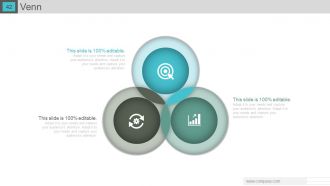
Slide 42: This is a Venn diagram image slide. State information, specifications etc. here.
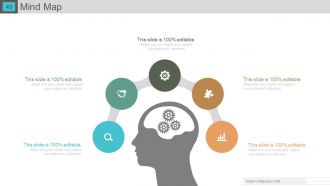
Slide 43: This is a Mind Map image slide. State information, specifications etc. here.
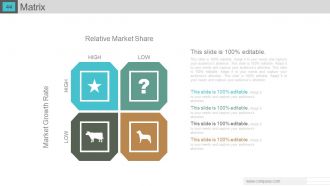
Slide 44: This slide presents a Matrix in terms of- Market Growth Rate, Relative Market Share, High, Low.
Slide 45: This is a Lego image slide. State information, specifications etc. here.
Slide 46: This is a Silhouettes image slide. State people related information, specifications etc. here.
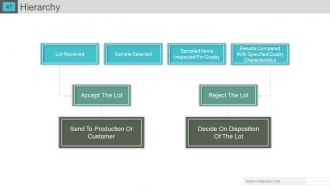
Slide 47: This slide presents a Hierarchy with the following content- Lot Received, Sample Selected, Sampled Items Inspected For Quality, Results Compared With Specified Quality Characteristics, Accept The Lot, Reject The Lot, Send To Production Or Customer, Decide On Disposition Of The Lot.
Slide 48: This is a Bulb/Idea image slide. State information, specifications, innovative aspects etc. here.
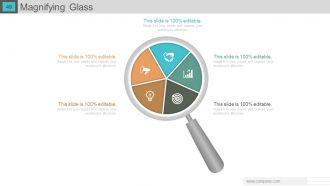
Slide 49: This is a Magnifying glass image slide. State information, specifications etc. here.
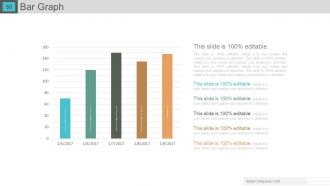
Slide 50: This is a Bar Graph slide to show product/entity comparison.
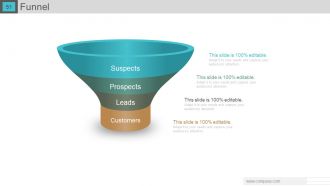
Slide 51: This is a Funnel image slide showing- Customers, Leads, Prospects, Suspects.
Slide 52: This is a Thank You slide to end a presentation.
Gap analysis powerpoint presentation with slides with all 52 slides:
Cut down on extra expenditure with our Gap Analysis Complete Powerpoint Deck With Slides. Display great economic efficiency.
-
GAP Analysis
-
Agenda
-
Gap Analysis Overview
-
Gap Analysis Procedure
-
What Do We Do To Get There
-
How Do We Do That
-
GAP Analysis Graph
-

Current State Analysis Company s Mission
-
Current State Analysis Our Market Share
-
Current State Analysis Financial Comparison
-
Current State Analysis Revenue Versus Target
-
Basic Gap Analysis Chart
-
Gap Analysis Template
-
Fit Gap Analysis
-
Gap Analysis Template
-
Skills Gap Analysis Template
-
Growth Share Matrix
-
Ansoff Product Matrix
-
Gap Analysis Tool Servqual
-
Servqual Model
-
Calculation Of Servqual Scores
-
Gap Analysis Tool SWOT Analysis
-

Gap Analysis Tool Fishbone Analysis 6 MS
-
Gap Analysis Tool McKinsey 7S
-
Gap Analysis Tool Nadler Tushman Congruence Model
-
Additional Slides
-
Mission and Vision
-
Our Team
-

About Us
-
Our Goals
-
Comparison
-
Financial
-

Quotes
-
Dashboard
-
Location
-
Timeline
-
Post It
-

Technical Support News
-
Puzzle
-
Target
-
Circular
-
Venn
-
Mind Map
-
Relative Market Share Matrix
-
Lego
-
Silhouettes
-
Hierarchy
-
Idea Bulb
-
Magnifying Glass
-
Bar Graph
-
Funnel
-
Thank You
FAQs for Gap analysis powerpoint
So you'll need to nail down where you're at right now versus where you want to be - sounds obvious but most people skip this part. Gather solid data and actually talk to the people involved because their input matters way more than you'd think. Once you've mapped out those gaps, prioritize them. Some will be total dealbreakers, others can wait. Create a realistic timeline with specific steps and ways to measure if it's working. Oh, and be brutally honest about your current situation - I've seen so many of these fail because people weren't realistic from day one.
Start by collecting data and talking to stakeholders to figure out where you actually are right now. Document everything - your processes, what you're good at, what sucks. Be honest about it. Then nail down exactly where you want to be with real numbers and goals. Getting input from other departments is clutch since they'll catch things you're blind to. Here's the thing though - most people sugarcoat their current situation and that just screws you over later. Once you've got both states mapped out clearly, the gaps are pretty obvious and you can tackle the biggest ones first.
Honestly? SWOT analysis and benchmarking are your best bets - super easy to jump into. Skills matrices work great too. Performance dashboards get fancier if that's your thing, or capability maturity models for more structure. But real talk, I've seen teams get amazing results with just a basic spreadsheet doing "where we are vs where we wanna be." Value stream mapping is clutch for processes (seriously, it's like magic), and if you're doing strategic stuff, McKinsey 7S is solid. Just pick whatever won't overwhelm your team and actually stick with it. Analysis paralysis kills more projects than bad frameworks do.
So gap analysis is basically your roadmap from point A to point B. Shows you what's actually missing - could be money, skills, market share, whatever. Honestly, most people skip this step and wonder why they're stuck later. You'll spot which gaps need fixing first so you're not throwing money at the wrong problems. Plus it uncovers opportunities you totally missed and risks that could mess things up. The trick is being real about where you stand right now - no BS. Then you can actually build timelines that make sense and won't leave your team burnt out chasing impossible deadlines.
Definitely talk to your stakeholders early - they're the ones dealing with the actual problems day-to-day. Without their input, you'll miss the real pain points and end up with solutions nobody wants. I learned this the hard way on a project last year, honestly. Different people will give you totally different takes on the same issues, which is actually super helpful for figuring out priorities. Don't just chat with the usual management crew either. Get perspectives from various levels - the frontline folks often have the best insights about what's really broken.
Gap analysis is basically comparing where your project is now vs where it should be. Look at timeline, budget, resources, deliverables - whatever's relevant. Honestly, this saved my butt on a launch last year when I realized we were way behind on testing. The trick is being brutally honest about your current situation (no sugarcoating). Map out what's missing or delayed. Then you can actually fix the problems instead of pretending they don't exist. It's great for catching issues before they blow up your whole project.
Data quality issues will kill you every time - incomplete records, inconsistent formatting, the usual mess. Getting departments to agree on future goals? Good luck with that. Marketing wants one thing, operations wants another. Scope creep's brutal too since everyone thinks their process is the most critical one to analyze. Start small though - pick one area, nail down your baseline numbers first. Leadership alignment saves you tons of headaches later. Oh, and don't let people dump random "urgent" requests on you mid-project. Stay focused.
Honestly, just pick specific numbers to track before you start fixing anything. Like if communication was the problem, don't just say "it got better" - actually measure response times or how many projects finish on schedule. Set your baseline first, then check those same metrics every few months. I usually do quarterly reviews but whatever works. The whole point is seeing if you're actually moving the needle or just spinning your wheels. Oh and be super specific about what "success" looks like upfront. Otherwise you'll never know if you actually solved the problem or just made yourself feel better about it.
Oh totally! I do this for my career stuff constantly. Map out where you are right now vs where you wanna be, then figure out what's missing in between. Way better than just taking random classes and crossing your fingers, you know? Works for promotions, career switches, whatever. The trick is being super honest about your current skills - like painfully honest lol. Then get really specific about your goal role's requirements. Compare the two lists and boom, there's your roadmap. It's honestly kind of eye-opening once you see it all laid out like that.
Tech and healthcare companies do these all the time because regulations change constantly. Financial services too - they can't afford to mess up compliance. Manufacturing loves gap analyses for quality stuff, which makes sense. Really though, if screwing up costs you serious money or gets you in regulatory trouble, you should probably do them quarterly. Slower industries? Maybe you can get away with once a year. I mean, there's no point overdoing it if your market barely shifts. The trick is figuring out how fast your competition moves and matching that pace.
Dude, technology is a game-changer for gap analysis. Data analytics tools automatically catch patterns you'd never spot by hand - saves so much time. Real-time tracking through project management software is clutch too. I'm obsessed with those visual dashboards because they make presenting to higher-ups actually bearable. Oh, and automation can monitor your KPIs constantly and ping you when something's off. My advice? Don't go crazy trying to implement everything at once. Pick one tool that meshes with what you're already doing. You'll thank yourself later.
For your gap analysis, you'll need three main buckets of metrics. First up - performance stuff like KPIs, conversion rates, customer satisfaction. Basically how you're doing versus where you want to be. Resource metrics are more straightforward: budget, headcount, tech stack, time. Capability metrics though? That's where it gets messy. We're talking skill levels, how mature your processes actually are, knowledge gaps on the team. Super important but honestly a pain to quantify sometimes. Just start with whatever data you've got lying around already. Then pick 2-3 of the biggest gaps and focus there first.
Honestly, most people say once a year but that's kinda the bare minimum. Fast-moving industries? You're gonna want to check quarterly, maybe even more if things are really crazy. I mean, think about it - regulations change, markets shift, your whole digital setup evolves. These aren't meant to be those documents you create once and forget about in some folder somewhere. Tie your reviews to when you're already doing business planning anyway, makes it way easier. Oh, and definitely set actual calendar reminders because otherwise you'll totally forget.
So basically, quantitative gap analysis is all about the hard numbers - performance scores, percentages, that kind of stuff. Pretty straightforward to see where you stand. Qualitative is more like... getting into people's heads? You're doing interviews and surveys to figure out *why* gaps exist, not just that they do. Honestly, mixing both works best. Numbers show you the problem, but you need the stories behind them to actually fix anything. I'd probably start with the data first to spot issues, then talk to people to understand what's really going on. Makes way more sense than trying to guess.
Look, external factors totally flip your gap analysis on its head. The market decides what "winning" means - like when everyone suddenly cared about sustainability over cheap prices. Your current skills might look completely different now. Economic changes, new rules, competitor drama - it all moves the finish line you're measuring against. Honestly feels like whack-a-mole sometimes. You've got to keep updating what's happening externally or you'll be shocked when that tiny gap becomes this huge problem. I learned this the hard way last year. Always check the market situation before trusting old analysis.
-
Illustrative design with editable content. Exceptional value for money. Highly pleased with the product.
-
Unique design & color.