


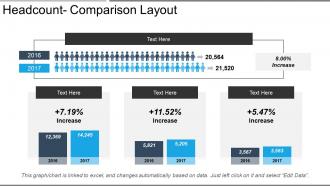
Headcount comparison layout






Try Before you Buy Download Free Sample Product
 Impress Your
 Audience
 100%
100% Editable
 Save Hours
 of Time


Establish you are in full control with our Headcount Comparison Layout. Have a firm hand on the helm.
People who downloaded this PowerPoint presentation also viewed the following :
Headcount comparison layout with all 5 slides:
Get the flow correct with our Headcount Comparison Layout. Ensure you don't jump the gun.



FAQs for
Start with the obvious stuff - revenue per employee and how many people each manager supervises. Then dig into utilization rates because honestly, nothing's worse than having people twiddling their thumbs for months while they "onboard." Time-to-productivity for new hires is huge too. Compare your headcount growth against actual business growth to see if you're hiring smart or just hiring. Don't just look at one snapshot though - track these month over month and stack them against industry benchmarks. Pull your current numbers first and see how you did versus last quarter.
So basically you're looking at your workforce data to figure out future hiring needs. Pull your hiring and turnover numbers from the past 2-3 years first. You'll start seeing patterns - like when people usually quit, which teams are growing, seasonal stuff. Honestly, it's pretty eye-opening once you map it out. The data shows skill gaps too, plus who might need replacing soon. Yeah, you can't predict everything perfectly, but it beats flying blind. Historical trends are your best friend here - they'll tell you way more than you'd expect about what's coming.
Headcount analysis is your starting point for workforce planning and budgets. Track your current staff monthly - it shows you exactly where you stand right now. From there, you can spot team gaps and predict hiring needs. Plus it calculates labor costs for budget planning. I used to think this stuff was super boring until I saw how much money companies blow without proper tracking! The data helps you decide when to hire and which roles matter most. Different departments need different allocation strategies too. Build your forecasts once you've got that baseline down.
Honestly, just ditch the job titles and focus on actual skills. List out what everyone on your team can do, then figure out what you'll need in the next 6-12 months. The mismatches jump out pretty quick - like having a bunch of junior devs but no seniors to guide them, or tons of tech people but nobody who can actually manage projects. Once you see the gaps laid out, you can decide if you need to hire, train people up, or just shuffle teams around. It's way clearer than you'd think.
Start with the basics - mean, median, percentiles to get a feel for your headcount spread. Time series analysis is clutch for spotting trends and seasonal stuff (really helps with planning). Regression analysis will show you what's actually driving headcount changes by department. Oh, and cohort analysis is solid for retention patterns - I always forget about that one but it's useful. For forecasting, ARIMA models work if your data's clean, otherwise stick with moving averages. My advice? Begin with simple trend analysis first. You can get fancy later once you know what you're looking at.
Check your turnover data quarterly - break it down by department and manager. You'll spot patterns super fast. Some teams bleeding people? That's your red flag. Honestly, certain managers always have higher turnover rates, which makes for fun HR meetings. Focus your retention money where the numbers are worst. Track tenure groups too - are new hires bouncing after 6 months or are veterans leaving? Different problems need different fixes. The best part? You can actually see if your retention stuff is working by comparing before/after headcount stability. Way better than guessing.
Your headcount analysis is gonna be way off if you don't factor in demographics. Age spreads matter for retirement planning - nobody wants to get caught with half their team hitting 65 at once. Geographic distribution messes with your budget since NYC salaries aren't the same as Kansas ones. Gender and diversity breakdowns? They'll show you if your hiring's biased (which happens more than people admit). Experience levels totally change your talent pipeline too. Don't just stare at raw numbers. Segment everything by these demographics or you'll miss what's actually happening.
Start with your HRIS like Workday or BambooHR - they've got all your employee data already sitting there. Excel's still my go-to for most analysis work, even though I know I spend way too much time in spreadsheets lol. Tableau and Power BI are solid choices when you need dashboards that won't put executives to sleep. SQL's worth learning if you're pulling large datasets regularly. There are fancier workforce planning tools like Visier, but honestly? They're expensive and might be overkill depending on your needs. I'd just work with whatever you can get your hands on first and expand later.
So headcount analysis basically gives you real numbers instead of just winging it with your D&I efforts. Break down your workforce by demographics - departments, levels, roles, all that stuff. Honestly, seeing the actual data can be pretty shocking sometimes. You'll spot gaps and weird patterns you didn't even know existed. Plus it helps you set targets that actually make sense and figure out where people are getting stuck in hiring or promotions. Oh, and tracking retention by group is huge too. Just start by pulling your current headcount and slice it by whatever diversity metrics matter most to you guys.
High turnover totally messes with your headcount planning - like, your numbers just become unreliable when people keep leaving. You're constantly backfilling roles, which creates these productivity gaps that throw off everything. Plus there's that whole ramp-up time for new hires that people forget about. I learned this the hard way when my projections were completely off one quarter. Build in a turnover buffer when you're forecasting headcount. Track your historical patterns by department too - some teams always have higher churn than others. Makes your predictions way more realistic.
Honestly, charts and dashboards are a game-changer for headcount stuff. You'll spot patterns instantly - like when departments balloon during certain seasons or which teams have crazy turnover. Way better than scrolling through endless spreadsheet rows when you're trying to make real decisions. Heat maps are perfect for showing where you're losing people, and trend lines tell you if hiring is actually matching growth (spoiler: it usually isn't). I'd start simple with bar charts showing headcount by team, then add quarterly data over time. Trust me, stakeholders love visuals way more than raw numbers.
Data quality issues will destroy your analysis faster than anything else. Make sure your HRIS info is actually current - stale data that's missing recent hires or departures is the worst. I've watched people freak out about "headcount drops" that were literally just normal end-of-year patterns, which honestly could've been avoided with basic research. Don't compare different time periods without thinking about seasonality first. Oh, and always double-check your date ranges match up. Context matters too - what else was happening during those months? Business changes throw off the numbers all the time.
Look, headcount analysis is basically your roadmap for not screwing up hiring decisions. You'll see exactly where you're overstaffed or missing people before it becomes a crisis. Plus you can time new hires with growth spurts instead of scrambling later. Think of it like checking your blind spots - shows the gap between where your team is now versus where you actually need to be. I'd run these every quarter though, because small staffing mismatches turn into budget nightmares fast. Way better to catch this stuff early than explain to your boss why you're suddenly hemorrhaging money on rushed hires.
Look, engaged employees don't bail on you as much - that's the biggest thing for headcount planning. Pull your engagement survey data and compare it with turnover rates. You'll probably see a clear pattern there. Low engagement = more people quitting = way more replacement hires to budget for. Plus engaged teams actually get more done, so you might not need as many bodies to hit targets. I learned this the hard way when we ignored engagement scores one year and got totally blindsided by departures. It's one of those metrics that'll save you from scrambling later.
Honestly, I'd hit up BLS first, then check out those Deloitte and PwC reports - they break down employee ratios by company size and function. LinkedIn's Workforce Report is actually pretty solid too, way more useful data than you'd expect. Look at your headcount per revenue, employees per manager, that kind of stuff. Also compare how you're splitting people across departments (sales vs ops, etc.) with similar companies. Just make sure you're not comparing your 50-person startup to some massive enterprise - totally different animals. I'd pull this quarterly instead of just once. Trends matter more than snapshots anyway.
-
Design layout is very impressive.
-
Awesomely designed templates, Easy to understand.