From selecting something as simple as soap to deciding which luxury car to buy, we encounter choices every day. And trust me, making the right choice is not a piece of cake! Whether it’s school, occupation, or any other choice, the consequences of a wrong decision can be devastating, costing you precious time, energy, money, and opportunities.
The question is how does one avoid indecision and make a suitable choice?
Doesn’t this scenario sound familiar? I know. We’ve all been there!
Choice is an on-going process that can’t be ignored. To make a choice one ought to compare products or entities taking various parameters into consideration. And that’s when comparison charts come in handy enabling us to make an informed decision.
People have been making comparison charts for many years. Comparison charts were discovered in the early 19th century to visualize data and convey information. This innovation led to an improved understanding of statistical data. And from then, the comparison charts have been used as visual aids for comparing groups, classes, distributions, and other values.
The Essence of Comparison Charts
Based on the idea of comparative methodology, comparison charts help to analyze and investigate various features, parameters, characteristics, etc, of the related products. They can be used to easily compare two sets of data, so long as they can be presented in the same format. They are also used for providing an accurate comparison of factual information containing similarities and differences.
Besides, having a mutual base for comparison is crucial to comparing two or more products. For instance, it would be a silly idea to draw a comparison between a fruit and a home. On the other hand, if you needed to choose between two employees, a comparative chart would help you understand which one performed better in similar situations.
The reason why comparison charts are so useful in all domains is that they efficiently convey important data by representing it visually to the reader. One can also use them to summarize the findings from a project by presenting the main points in a chart format; thereby, identifying important trends and patterns that were uncovered during the research process.
As interesting and appealing as it sounds, creating a comparison chart has challenges of its own. However, our comparison chart templates will save the hassle. Designed by professionals, our stunning collection of templates will allow you to convey information graphically. They will make it quicker and easier for your audience to absorb the data than if the information was in text form. These PPT designs are fully customizable, exclusive, and relevant for almost every situation. Just tweak them as per your needs and get going!
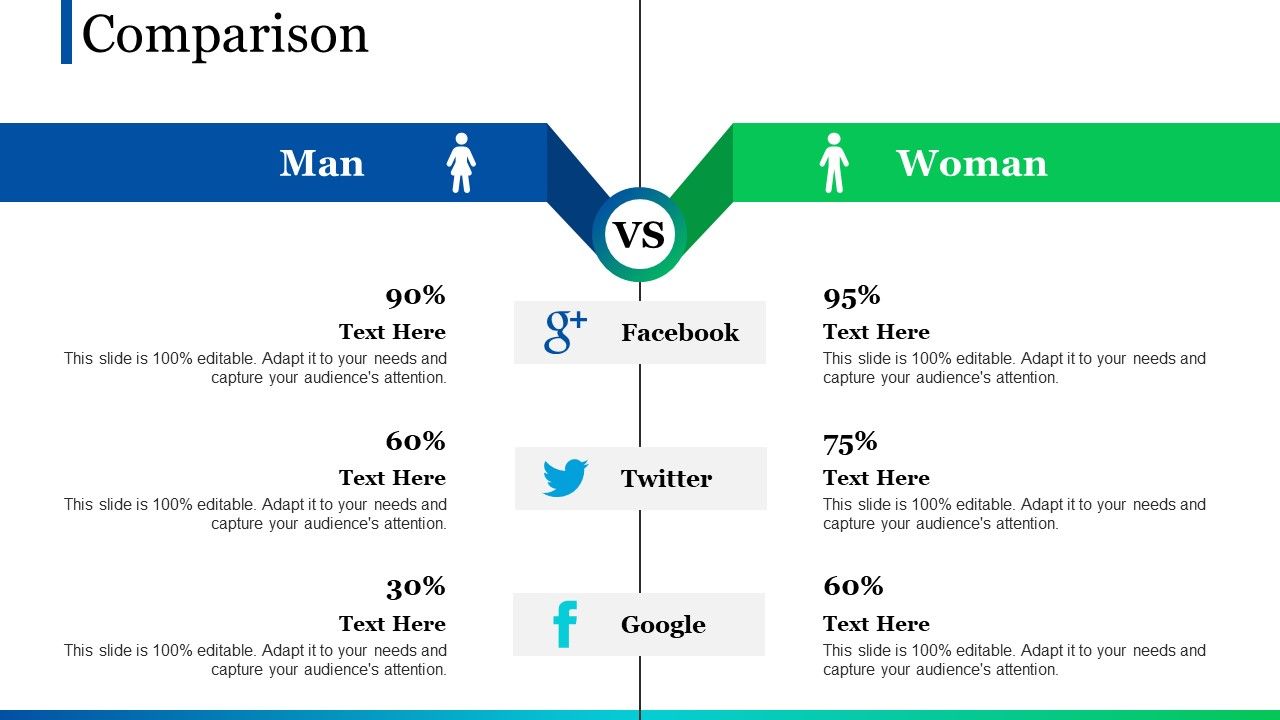
Template 1: Comparison PPT Slide
This PPT Set facilitates a concise analysis of gender distribution among your audience across prominent platforms. Focusing on Facebook, Twitter, and Google, this slide visually represents male and female engagement on these critical social media channels. With clear graphics and data points, it provides insights into gender demographics, aiding presenters in understanding platform-specific audience dynamics. Enhance your presentations with this visually appealing template, fostering a more profound comprehension of your audience's gender distribution across major online platforms—essential for tailoring marketing strategies and content to resonate with diverse demographics.
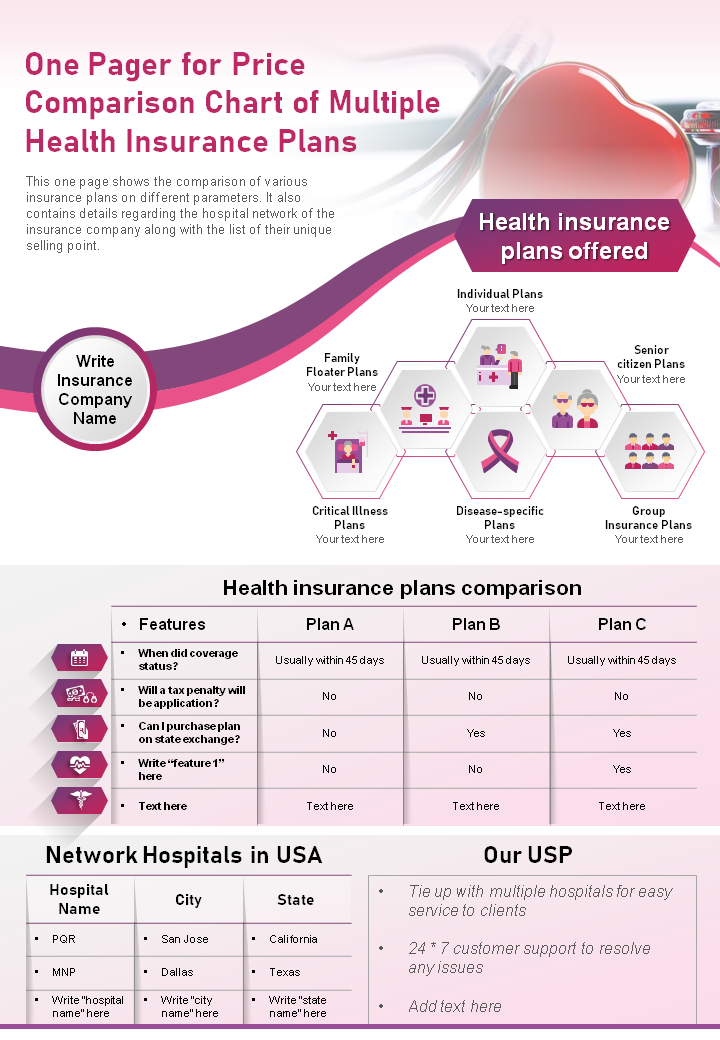
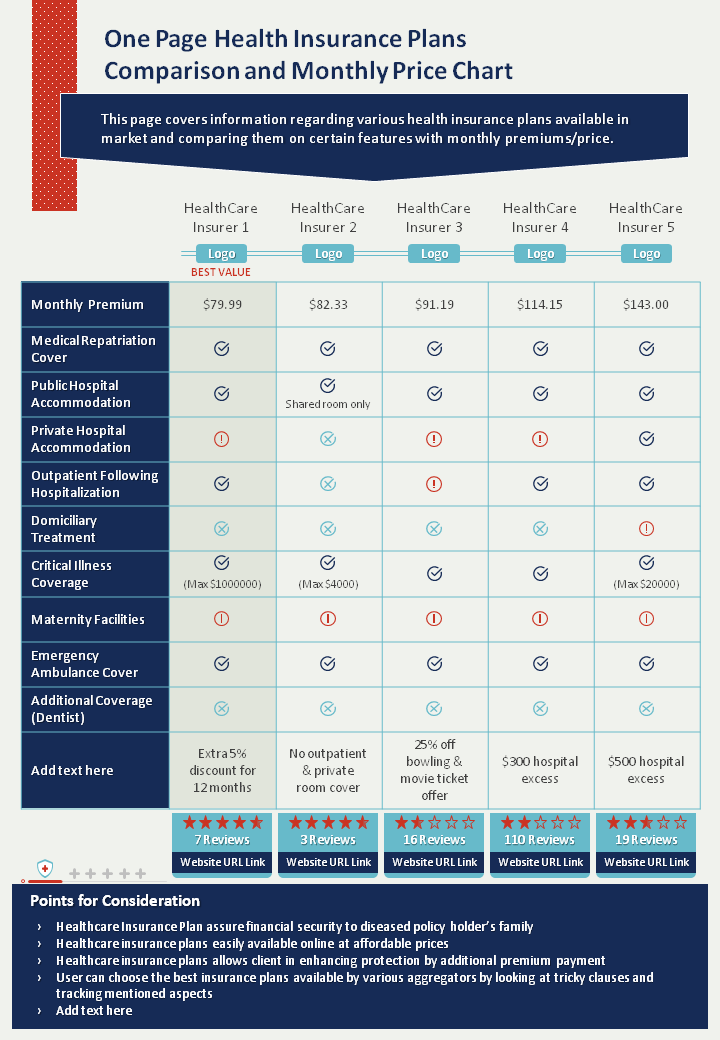
Template 2: Price Comparison Chart PowerPoint Template for Health Insurance Plans
Health insurance plays a vital role in today’s time. Use this well-designed PPT template to ensure that you make the right choice. This fully customizable one-pager will help you understand various features of health insurance plans by comparing the prices. So download it right away.
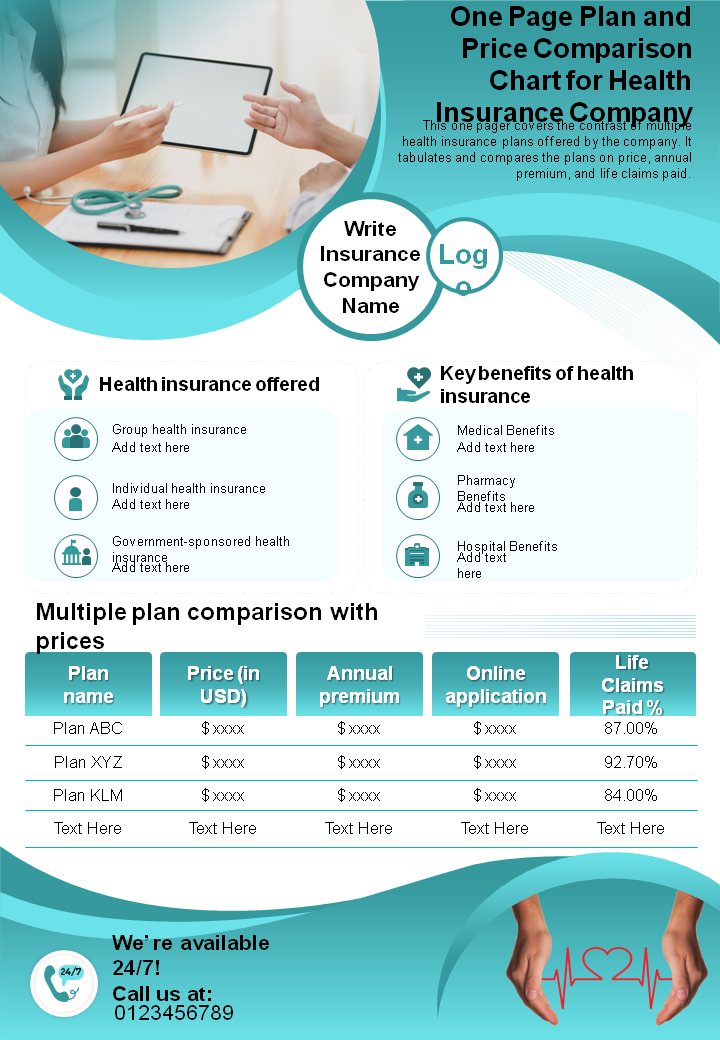
Template 3: Health Insurance Company Price Comparison Chart PPT Template
Download this PPT template to compare key benefits covered by an insurance plan like group insurance, premium insurance, and more. Additionally, you can analyze the price difference among various insurance plans and choose the perfect one according to your needs. You can also use it to illustrate traits, such as ease of online application, premium benefits, etc.
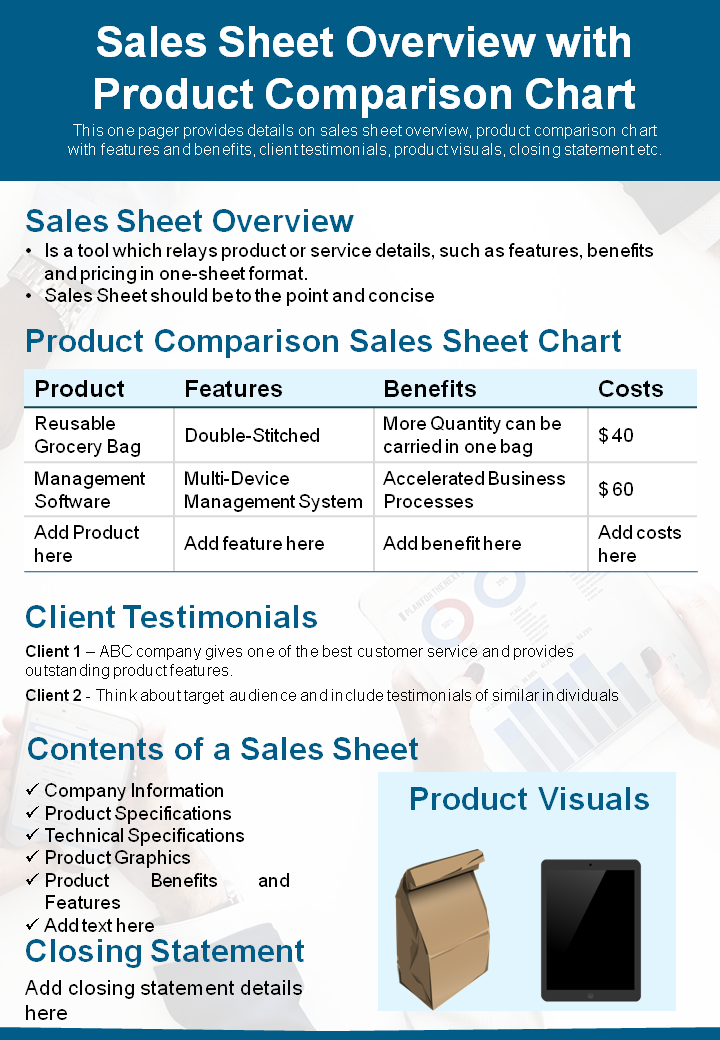
Template 4: Sales Sheet Overview with Product Comparison Chart PPT
Keeping a sales track is a task! It can be overwhelming to manage the data and monitor progress efficiently. This sales sheet overview PPT template will help you analyze and understand the sales of different products along with their distinctive features. Grab this template today and create an impeccable comparison chart.
Template 5: Health Insurance Plans Comparison Chart Template
Pitch a comparison of your insurance services like a pro with this stunning health insurance plan comparison one-page PPT template. With this design, you can discuss various features like fixed benefits plans, indemnity plans, etc. Using this design you can also represent client testimonials and enhance the credibility of your company. So why wait? Download now.
Template 6: Monthly Health Insurance Plan Comparison Chart PPT
Compare different health insurance plans with this professionally designed PowerPoint template. This design with help you enumerate various benefits and features of an insurance plan, such as medical repatriation, public hospital accommodation, etc. Grab this template now!
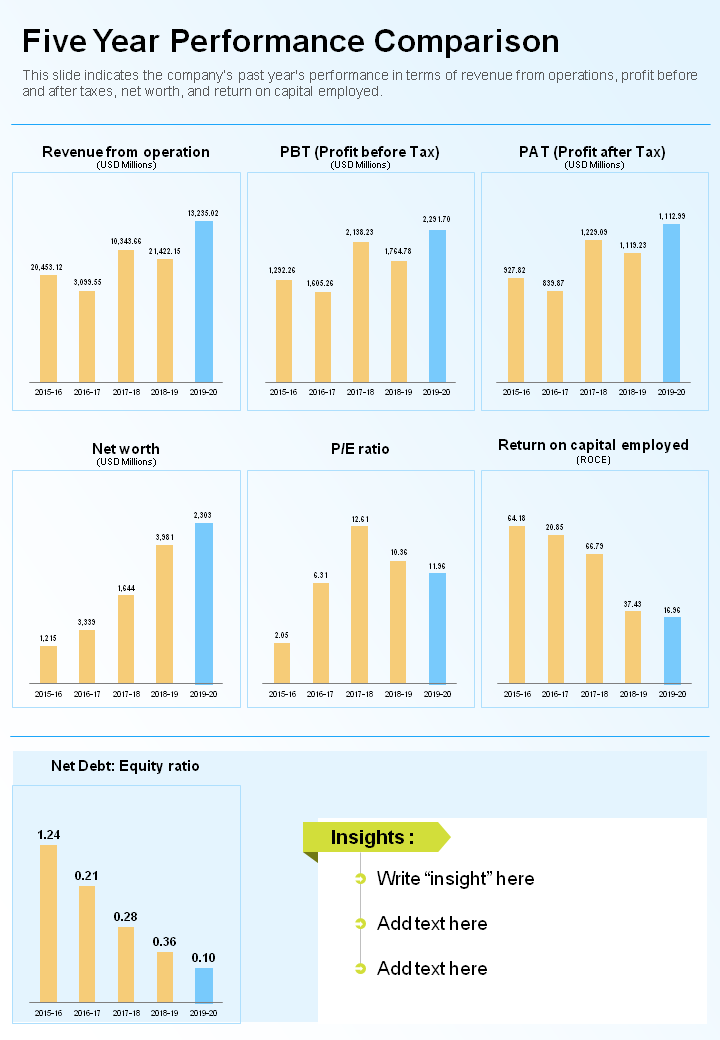
Template 7: Five-Year Performance Comparison Template
Tracking information over time can be hectic. This well-designed PPT template will ensure an easy and appealing representation of data over five years. You can use it to highlight the distinguishing elements like revenue from an operation, profit after tax, net worth, net debt, and more. Download this design today!
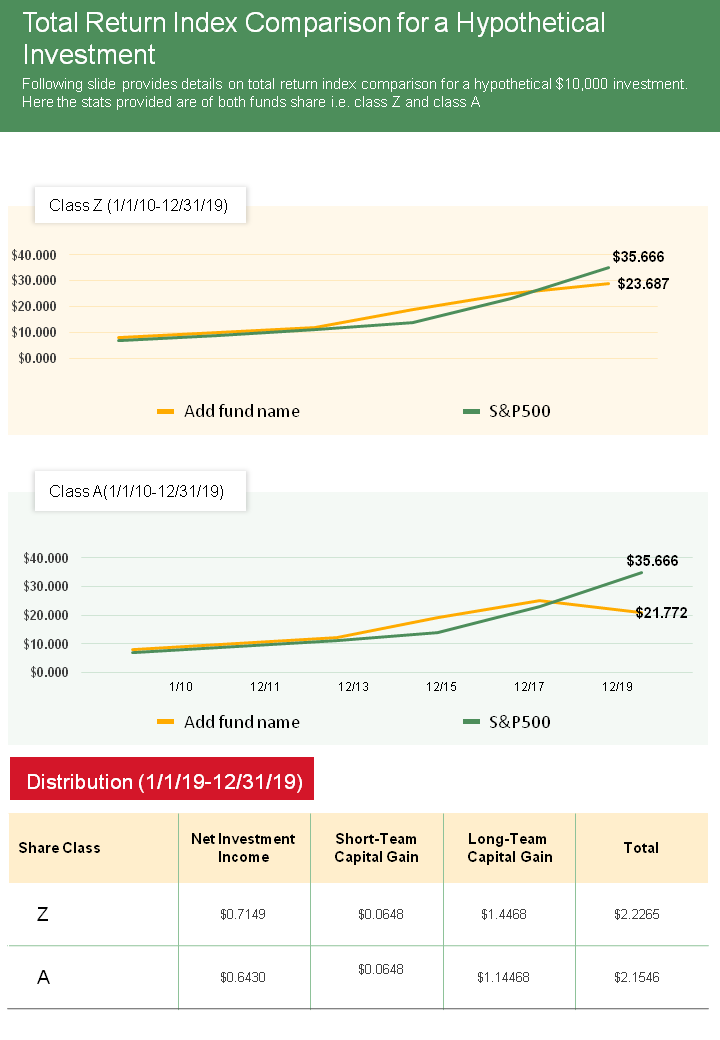
Template 8: Total Return Index Comparison PPT
Track capital gains and cash distributions with this predesigned total return index comparison one-page template. This layout is easy to understand and fully editable. So download it now and present the data graphically to persuade an informed investment decision.
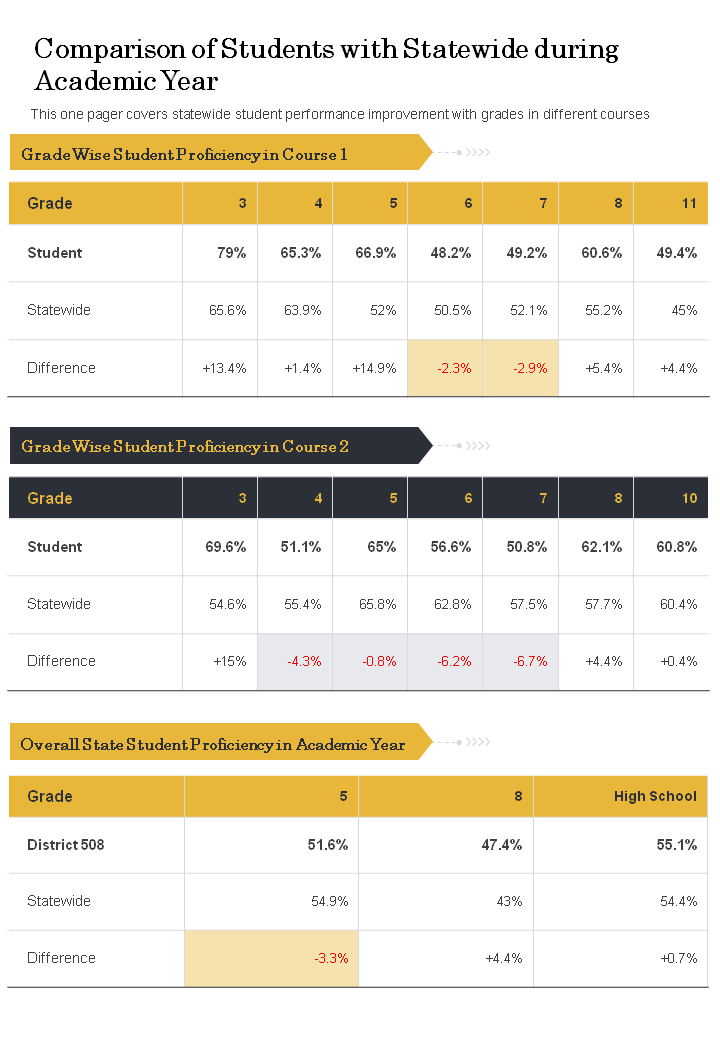
Template 9: Academic Year Comparison Chart PPT Template
Academic performance is a key factor in evaluating the growth and quality of the education system. This template will assist you in analyzing the proficiency level of students based on the grades of two courses. Grab this template today and establish an effective comparison!
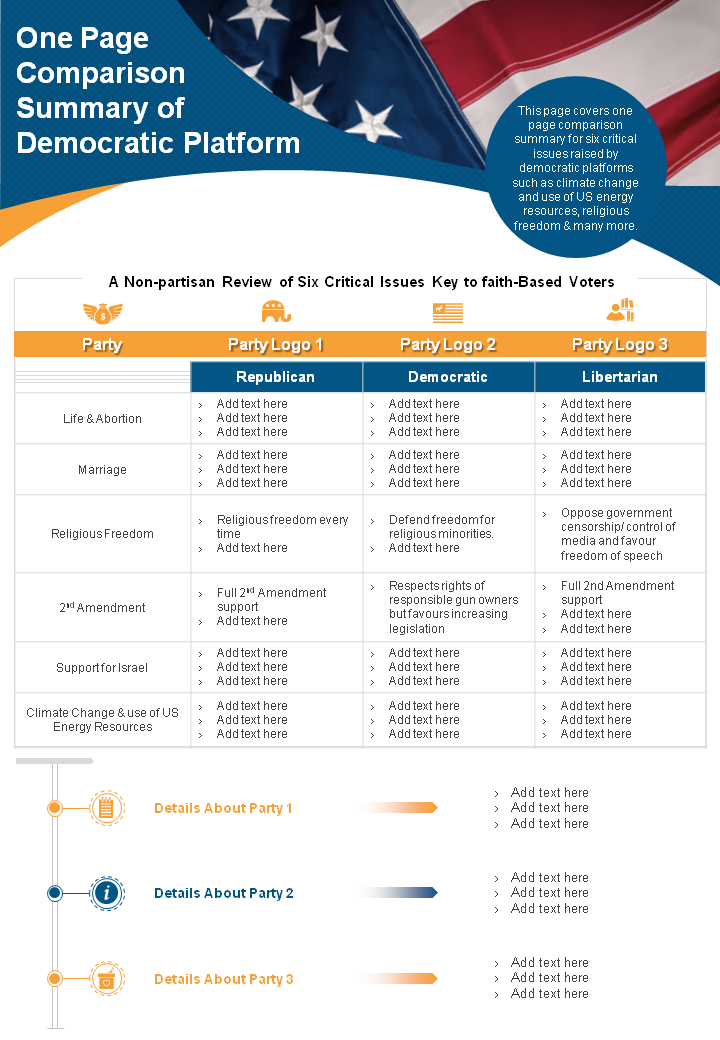
Template 10: One-page Comparison Summary of the Democratic Platform
Politics plays an integral role in shaping society. Download this PPT template to compare and contrast various political parties. From enumerating party logos to tabulating their stance on critical issues, we have got it all covered in this informative democratic platform comparison summary template.
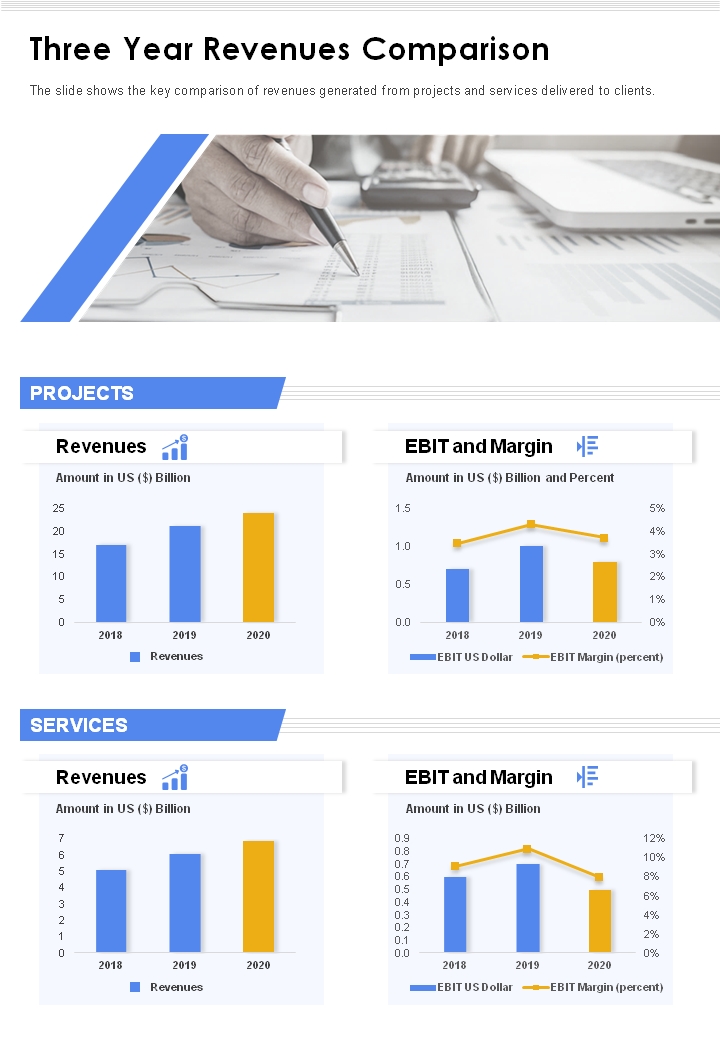
Template 11: Three-Year Revenue Comparison Template
Revenues are the driving force behind any business. Analyzing and understanding the revenues over a period can offer insight into the progress/decline of a business. Using this amazing template, you can easily compare revenues for a 3-year duration. You can separately compare the revenue generated from the projects and services. Besides, the given template is completely editable and easy to use. So get this template now!
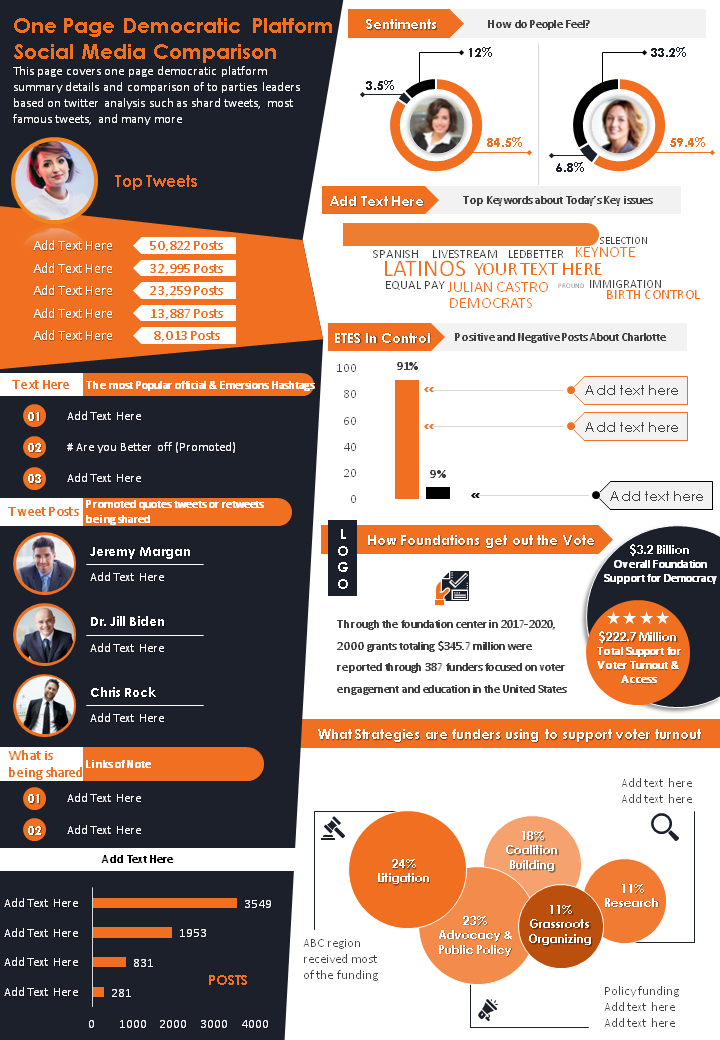
Template 12: Democratic Platform Social Media Comparison PPT
Social media is the air of modern society. Political activities and social media platforms are intricately interwoven. This high-quality one-pager template will help you compare different party leaders based on their tweets, posts, and more, to ensure an informed decision. You can use this design to discuss various strategies employed by funders to attain the maximum voters. Download this design and get started now!
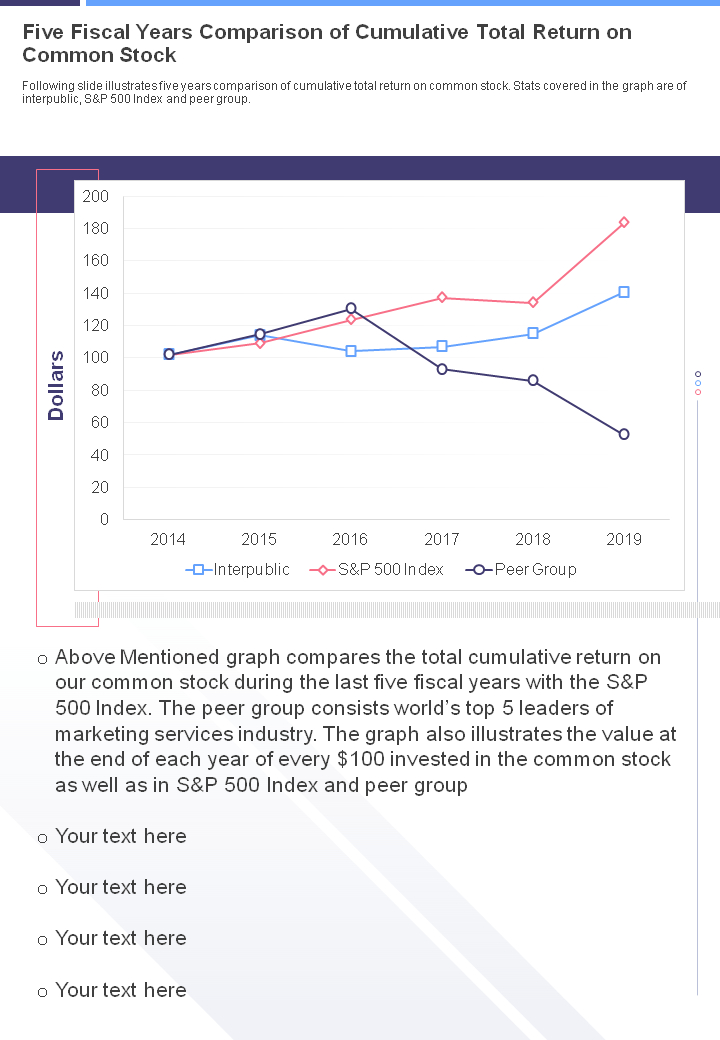
Template 13: Five Fiscal Year Comparison Chart Template
Download this five fiscal years comparison one-pager to calculate the cumulative total returns on common stock. This template is fully customizable and easy to understand. You can use this layout to compare different companies, prices, stock market indexes, etc, to make better investment-related decisions.
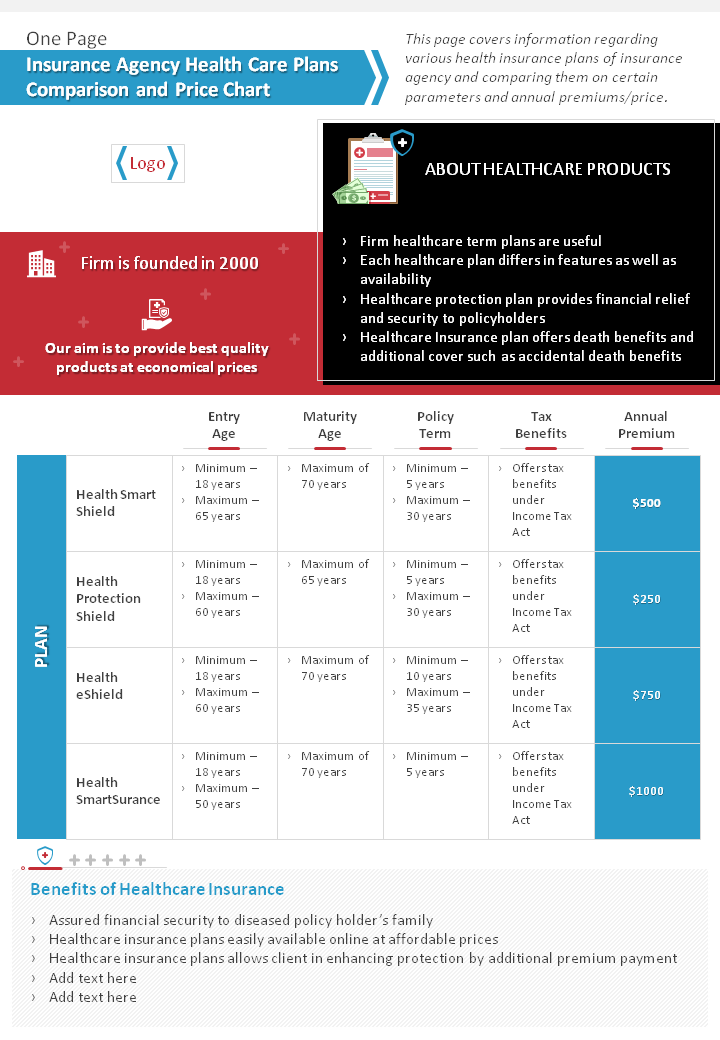
Template 14: Insurance Agency Health Care Plans Comparison PPT
Deciding on a health insurance plan is not easy! Endless efforts go into evaluating different parameters to finally choose a plan that meets your medical requirements efficiently. From comparing annual prices for each plan to investigating factors like entry age, maturity age, tax benefits, etc, this template offers a complete comparison sheet to assist you to make an informed decision. Get this template now!
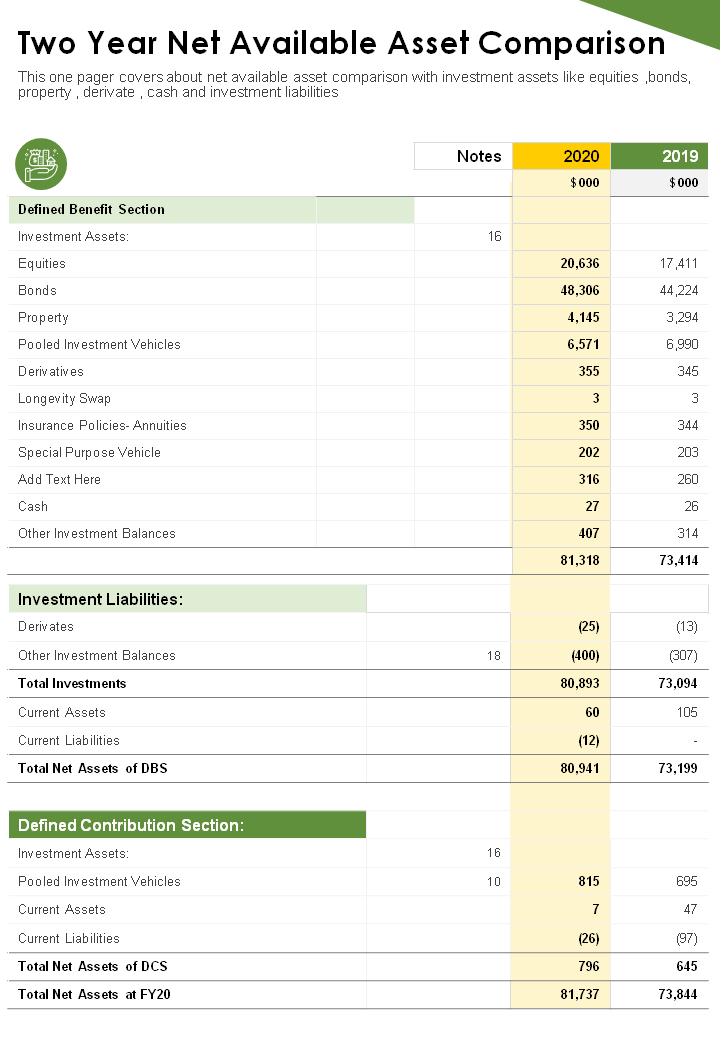
Template 15: Two-Year Net Available Asset Comparison Template
Having a proper understanding of the available assets can provide an edge in making sound and superior decisions. Deploy this asset comparison one-pager to compare elements, such as investments, equities, bonds, liabilities, derivatives, and much more over two years. Besides, you can easily edit this PPT design to modify and compare the data as per your requirements. Hurry! Download this template today.
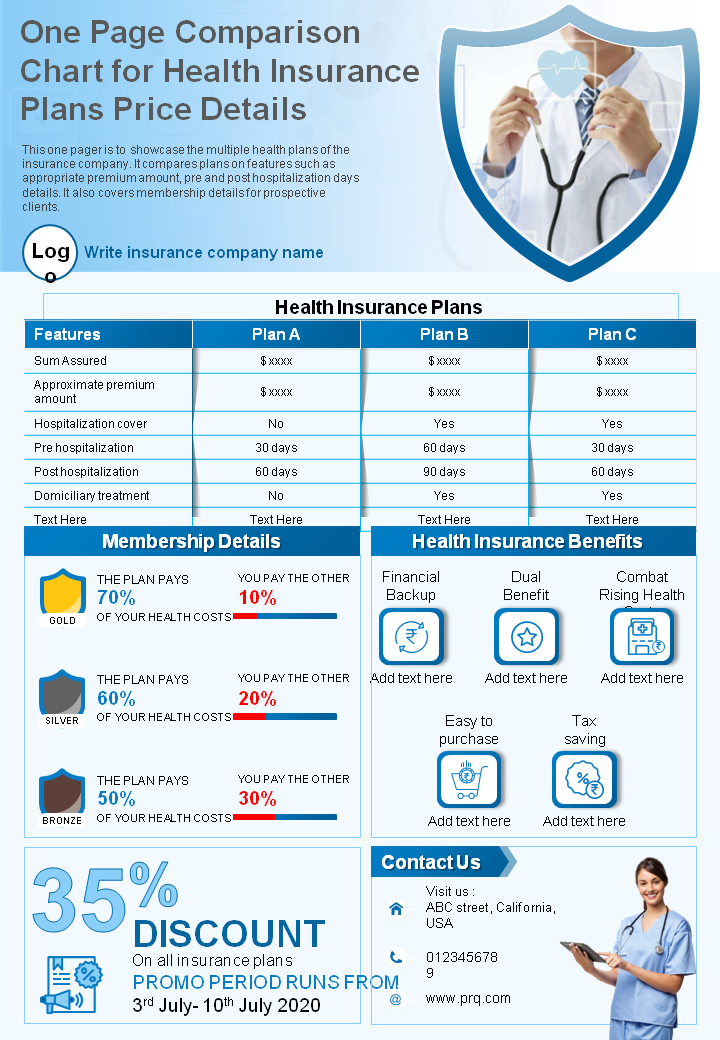
Template 16: One-Page Comparison Chart for Health Insurance Plans
Get the best health insurance plan by comparing different options available in the market. Use this template to enumerate multiple features and parameters, such as health checkups, cashless treatments, policy for senior citizens, etc. You can also have a detailed analysis of the price and facilities offered with this template. Download it today!
To Sum it Up!
Comparing data visually is a great way to understand information and make decisions. Comparison charts must not just be beautiful—but easy to read and comprehend. They are a handy tool for summarizing huge details and showcasing results/contrasts at a glance, making them a suitable medium for an informed decision.
Therefore, you can download these professionally designed, easy-to-edit templates and present information efficiently without losing the interest of your audience. Enjoy unlimited access to these stunning comparison chart template collections and create perfect presentations in minutes!
P.S: Give your information a visual boost by exploring this comparison PPT template featured in this guide.




 Customer Reviews

