


 Customer Reviews
“If men liked shopping, they'd call it research." As you enjoy this quip from an American author, be clear that women have already mastered this art!
Even as the war of genders is nothing serious but light banter, the universal truth is that a fruitful shopping experience is bound to follow a responsible shopping approach. Thus, surveying the market before going for any purchase is an absolute must. Only then will an enlightened customer make an informed decision.
To ensure that this happens, business prepares and displays a price comparison chart. This blog presents such price comparison chart templates for your business to generate awareness.
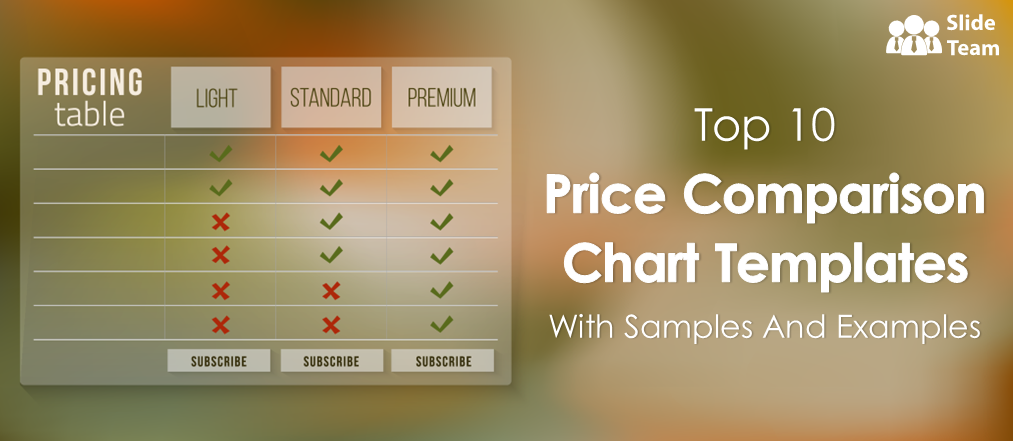
What is a Price Comparison Chart?
A price comparison chart lists the products, services, and plans a business offers, along with their features and benefits. This is organized in an ascending or descending order of prices to help customers locate ideal choices of purchase. Butterfly charts, tornado charts, pie charts, and columnar charts are common ways to represent price comparison.
Thus, a visual representation helps distinguish between products and services based on prices and the features they exhibit. Businesses must ensure that the information presented in a price comparison chart must be clear and associated terms and conditions are conveyed alongside. This helps avoid any confusion or misinformation which, in turn, guarantees customer satisfaction.
Having said so, browse through our collection of price comparison chart templates summarized in this blog. Grab these 100% editable and content-ready designs to showcase the range of packages that your business has to offer.
Template 1: Product Comparison Chart With Pricing Table
This is an all-in-one PPT Presentation to share package subscriptions that your business offers. Compare products based on technical features, competitiveness, market demand etc and then put a price tag to them. Use graphs, charts, and tables to depict this comparison and help customers make better decisions. You can also use this compilation of informative graphs for training and to make insightful conclusions. Download now!

Template 2: Bi-Fold Plan and Price Comparison Chart for Health Insurance Company
Looking for a document template to present and share your insurance plans?This bi-fold plan and price comparison document is content ready and editable. Use it to share a comprehensive list of insurance plans that you provide. Highlight key benefits of buying insurance with special mention of the USP of your company. Wrap it up with your contact details, accurately matched with the present status of your organization and distribute his well-prepared document among your prospective members. Download now!

Template 3: Bi-Fold Price Comparison Chart for Insurance Company
Use this bi-fold document template to advertise your company’s insurance plans. Share the levels of health plans while mentioning the benefits for each member along with the package price. Share procedures for getting enrolled and also shed light on your achievements as a successful health insurer. Download this content-ready PPT Presentation to share these useful insights.

Template 4: One-Pager Price Comparison Chart of Multiple Health Insurance Plans
Looking for a one-page template to showcase your health insurance plans? Here is a content-ready template to set up a price comparison among insurance plans that your company offers. Enlist typical features of these policies to distinguish the muti-priced plans. To advertise your credibility, list major hospital networks that your insurance company has tie-ups with. All this information can be explicitly mentioned in this editable pink-themed PPT layout, so grab now!

Template 5: One-Page Price Comparison Chart for Insurance Company
Set up a price comparison of your company’s health insurance plans, that this dedicated one-page template offers all businesses. Categorize plans into premium, standard, and basic and list features offered. Share highlights of your achievements over a timeline, using the same design. Specify the procedure to follow to acquire your company’s insurance. Don’t forget to share your contact details for members to get in touch. Download this content and design-ready price comparison chart template now!

Template 6: One-Page Plan and Price Comparison Chart for Health Insurance Company
Opt for this another one of our plan and price comparison chart template for your company. Focus on the different insurance plans offered by your company in ascending order and highlight newer perks the higher your customers go. Entice your audience with the general health insurance benefits covered by your company and the scope of members that can be covered in it. Download this 100% editable PPT Layout now!

Template 7: Butterfly Chart Tornado Chart for Price Comparison PowerPoint Slide
Price comparison is useful for evaluating suppliers to your business and this PPT Layout helps you do just that. Compare raw materials, including delivery charges in doing business with suppliers, as shown in this price comparison template, and make your choice in light of these variables. Use this butterfly chart to contrast prices and ease decision making meant to deal with an important part of your supply chain management. Download now!

Template 8: Price Comparison Chart PowerPoint Shapes
Pricing is an important part of product development strategy using which marketers establish the most apt price and positioning of a product. Use this price comparison chart template to identify the best price tag for your product or service, compared to competition and customer affordability. Identify good to thrive and expand as a brand and steer clear of unnecessary risk. Also, this is a great way to forecast and plan sales or your highest and lowest grossing products. To use this PPT Template to the fullest, click on the download link below.

Template 9: Sales Strategies Playbook With Price Comparison Chart
Here is a single-slide template to compare brand products on their price. Fill details regarding their price per unit, changeover list and price percentage. In addition, , specify their revised prices and reason for the proposed price. Showcase sales volume , and thus, the forecast growth in sales and present this data on this single tabular slide. Use this data to determine the highest grossing product and the lowest grossing product to redirect product strategies. Download this editable PPT Layout now to compare multiple products, price-wise, just at a glance.

Template 10: Product Comparison Chart with Service and Pricing
Is your company offering a combination of product and services under price packages? Then use this service and pricing comparison chart to share how starter basic, standard, and premium packages differ in features and services included. Highlight their availability and cross out their deficiencies as shown in this editable PPT Diagram. Download now.

BE RELEVANT, BE APTLY PRICED
Share snapshots of price comparisons between products, services, and packages with these editable PPT Templates. Help your audience opt for the most relevant plans with a mere look.
PS: Company comparison is something both the investors and the employees do at least once to make better future decisions. Use our company comparison chart templates put together in this blog to contrast companies to decide the best ones to affiliate with.
FAQs on Price Comparison
How do you do a price comparison?
As a customer, you must compare prices between similar products from the same brand or across brands to get your hands on standard products. This helps you avoid buying extremely-priced products. Under this comparison, customers can contrast features and evaluate products, services, and experiences based on the value that they offer.
Businesses can showcase a comparison of their existing products with each other or with their newest launches.
A price comparison chart showcases any additional features, step ups, and improvements that have been introduced. Such a chart is created to cater to a range of audiences who find respective packages affordable. A comparison helps businesses showcase the range of expenses from manufacturing, through logistics, till the final delivery of product.
Price comparison can be drawn to perform competitor price analysis, construction cost comparisons, sellers price comparison etc.
Which chart is best for price comparison?
In order to best depict a price comparison, columnar charts serve as the best aid to understanding. Products, services, plans, or experiences of different prices, can be compared side by side with their features, range, and other properties. This can also include any additional taxes, shipping charges to be levied along the way. Thus, a side by side comparison can help anyone choose their best fit.
Other types of graphs that can come in handy are:
- Comparison Bar Charts
- Slope charts
- Progress Charts
- Tornado chart
- Pie Chart
- Double Bar Graph
- Donut Chart
- Matrix Chart
- Stacked Bar Chart
- Dual Axis Grouped Bar Chart
How are butterfly and tornado charts used in price comparison?
To show price-related information, such as the distribution of prices or the impact of varied factors on price, butterfly charts and tornado charts are the best option. Here is how these charts can be used for price comparison:
Butterfly Chart: A butterfly chart, also known as a dumbbell chart, is used to depict the change or difference between two values. For price comparison, a butterfly chart can be used to show the difference in prices between two products or services. Each value is represented by a horizontal bar, with a vertical line connecting the bars to show the difference. The bars can be color-coded to represent brands or providers.
Tornado Chart: A tornado chart, also known as a barbell chart or a sensitivity chart, is used to show the impact of factors on a particular outcome. For price comparison, a tornado chart can be used to show how factors, such as discounts or taxes, impact the overall price of a product or service. The chart shows the factors on the left side and the corresponding impact on the right side, with the bars ordered from the highest to the lowest impact. The bars can be color-coded to discern the positive from the negative.


![Top 10 Product Specification Templates With Samples and Examples [Free PDF Attached]](https://www.slideteam.net/wp/wp-content/uploads/2022/11/product-specification-templates.jpg)

![[Updated 2023] 20 Pie Chart Templates to Draw Intuitive Comparisons](https://www.slideteam.net/wp/wp-content/uploads/2021/11/gif-1013x441-1.gif)
![15 Inverted Pyramid Structure Templates to Improve Audience Engagement [Free PDF Attached]](https://www.slideteam.net/wp/wp-content/uploads/2022/01/1013x441no-button-9.jpg)

