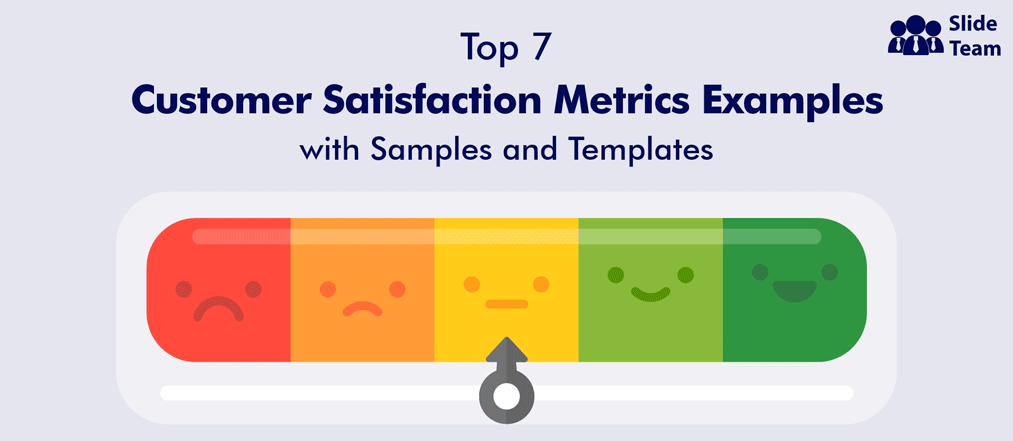


 Customer Reviews
A customer prefers your business over your competitor. What forges this loyalty?
Aside from your brilliant, well-timed engagement efforts to delight the customer, what fuels this devotion of regularly showing up at only your store is customer satisfaction. Quality products and quick resolution of customer grievances make your business irresistible and this nurtures the dependency on your products, services, and the overall shopping experience.
Can businesses quantify this satisfaction among customers to measure, compare and improve on it? Yes, a range of customer satisfaction metrics make this possible.
Customer satisfaction metrics help businesses measure their relevance and likeability among customers in a more tangible and visible form than the mere likeability customers express for their products.
A common way to do this is to share feedback forms with purchasers to assess their shopping experience. Satisfied customers will do so willingly.
Using this data, customer satisfaction metrics such as Customer Satisfaction Score (CSAT), Net Promoter Score (NPS), Customer Effort Score (CES), Churn Rate, Customer Retention Rate (CRR), and Customer Lifetime Value (CLV), are gleaned out.
Are your executives familiar with these customer satisfaction metrics? Is your business grading customers and therefore staying relevant to the market dynamics and fickle customer preferences?
Our Solution in the Form of Templates
Use SlideTeam’s exclusive designs and templates to bring consummate ease in measuring and presenting insights on customer satisfaction metrics. Identify business aspects that need improvement and focus on enhancing customer satisfaction.
As always, each of these presentation templates is 100% editable and customizable. This provides you with the flexibility to edit your presentations. The content-ready slides give you the much-needed structure.
Let’s study these templates!
Template 1: Customer Satisfaction and Performance Metrics PowerPoint Presentation
Here is a training module template to create customer satisfaction and performance metrics for your business. Discuss the strategy to generate satisfaction and then decide on how to measure and track it for proper feedback implementation. Additionally, deploy the well-researched graphs, and charts that this PPT Presentation curates to effectively visualize this data. Grab the template now!

Template 2: Call Center KPI Dashboard Snapshot Showing Key Metrics of Customer Satisfaction
Customer satisfaction relies heavily on how quickly and effectively their concerns are understood, acknowledged and resolved. Present data from your call center in rendering a smooth customer experience with this PPT Layout. Measure costs against customer satisfaction these generate using bar graphs as shown. You can alo track the volume increase in customer calls over the years to represent your customer support activity and its increasing relevance to the entire customer experience and journey with your products and services. Download now!

Template 3: Healthcare Dashboard with Customer Satisfaction and Patient Metrics
Track the customer satisfaction with your healthcare facilities and amenities provided in your community with this PPT Dashboard. Create a separate record of data related to patient metrics and feedback across departments. The patient metrics are recorded at four timeframes: From arrival in the healthcare facility till bed; arrival to nurse; arrival to physician and arrival to discharge. The performance of departments is analyzed based on the salary of each versus the average salary across the organization per se. Use this data to determine customer satisfaction with respect to the patients and the staff. Graphs and charts enhance the data interpretation. Download now!

Template 4: Key Metrics with Revenue Cost Profit per Sale and Customer Satisfaction
Monitor the success of your holiday sales and campaigns by analyzing the cost, revenue, and profit generated per lead. Use these metric charts of the PPT Slide to present this data effectively. Use this template to track new customers gained along the way. Click on the link below to grab this customer satisfaction metrics presentation template now.

Template 5: Customer Satisfaction Metrics Comparison of Two Products
If your business has launched two products simultaneously, or in succession, and wants to compare the generated customer satisfaction, here is the PPT Slide to do so. Identify promoters, passives,and detractors to get an overview of how and why customers perceive each of the two products and how well it is liked by your purchasers. Download this Excel-linked metric diagram now!

Template 6: Metrics to Measure Customer Satisfaction Template
Want to decipher how parameters related to your products and services will affect customer satisfaction? Deploy this content-ready PT Design to compare and analyze the effect of change in price, quality and time of launch etc to predict customer response. Play around with varied parameters to assess the optimal conditions of obtaining customer satisfaction. Download now.

Template 7: Business Value Metrics Template
Assess customer satisfaction for business aspects to understand areas of improvement and excellence. Use this data to, then, guide your business investments. Track expenditure across business units and then present data of customer satisfaction for business-facing activities. If the information is overwhelming, deduce key takeaways for your team to understand and work upon. Download now.

Template 8: Customer Satisfaction Survey PPT Clipart
Finally, let this customer satisfaction survey PPT Chart guide your feedback form preparation to focus on asking the right questions. Use this PPT Slide to create feedback/ survey forms with appropriate options to choose from or tick. As shown in this PPT Slide, you can include questions pertaining to the usage, likeability, and relevance of your business for customers. Download now!

MEASURE CUSTOMER ENGAGEMENT
Start measuring customer contentment with your products and services by deploying these content-ready PPT Templates.
PS: To enhance customer interaction and create a world-class, smooth experience, assess the purchasing cycle that customers go through. Use our PPT Diagrams as presented in this blog to ensure they enjoy doing business with you.
FAQs on Customer Satisfaction Metrics
What are four key metrics of customer satisfaction?
The four key metrics of customer satisfaction are:
- Customer Satisfaction Score (CSAT): This metric measures the overall satisfaction level of a customer with a specific product, service, or experience. It is measured through a survey question that asks customers to rate their satisfaction on a scale of 1 to 5 or 1 to 10.
- Net Promoter Score (NPS): This metric measures customer loyalty by asking customers how likely they are to recommend a product or service to others on a scale of 0 to 10. Customers who give a score of 9 or 10 are considered promoters, while those who give a score of 0 to 6 are detractors.
- Customer Effort Score (CES): This metric measures the ease of doing business with a company by asking customers how easy or difficult it was to resolve their issue or complete a task. It is measured through a survey question that asks customers to rate their effort on a scale of 1 to 5 or 1 to 10.
- Churn Rate: This metric measures the percentage of customers who stop using a product or service over a given period of time. A high churn rate can indicate customer dissatisfaction or a lack of loyalty.
Other metrics that businesses can use are:
- Customer Retention Rate: This metric measures the percentage of customers who continue to do business with a company over a given period of time.
- Customer Lifetime Value (CLV): This metric measures the total amount of revenue a customer is expected to generate for a company during the course of the business relationship with your company.
What are the 3Cs of customer satisfaction?
The 3 Cs of customer satisfaction are:
- Consistency: Consistency refers to providing a consistently high level of service or quality in customer interactions, across channels and touchpoints. Customers expect a consistent experience and are more likely to be satisfied when they receive it.
- Communication: Communication refers to actively engaging with customers, listening to their needs and concerns, and keeping them informed about updates, changes in your products and services, and solutions. Good communication builds trust, establishes expectations, and creates a positive customer experience.
- Customer-centricity: Customer-centricity refers to putting the customer at the center of everything a company does, and designing products, services, and processes around their needs and preferences. By understanding the customer's perspective and providing personalized experiences, companies can improve customer satisfaction and build long-term loyalty.
What are the 5Ps of customer satisfaction?
The 5 Ps of customer satisfaction are:
- Product: This refers to the quality, features, and design of the product or service being offered. Customers expect products to meet their needs and exceed their expectations in terms of functionality, durability, and value.
- Price: The second P is price, which refers to the perceived value of the product or service in relation to its cost. Customers expect prices to be fair and competitive, and to reflect the quality and benefits of the product or service.
- Place: The third P is place, which refers to the availability and accessibility of the product or service. Customers expect products to be available where and when they need them, whether that's in-store, online, or through other channels.
- Promotion: This is the marketing and communication effort used to promote the product or service. Customers expect promotions to be informative, engaging, and relevant to their needs and interests.
- People: The fifth P is people, which refers to employees who interact with customers and deliver the product or service. Customers expect employees to be knowledgeable, helpful, and friendly, and to provide a positive and memorable customer experience.