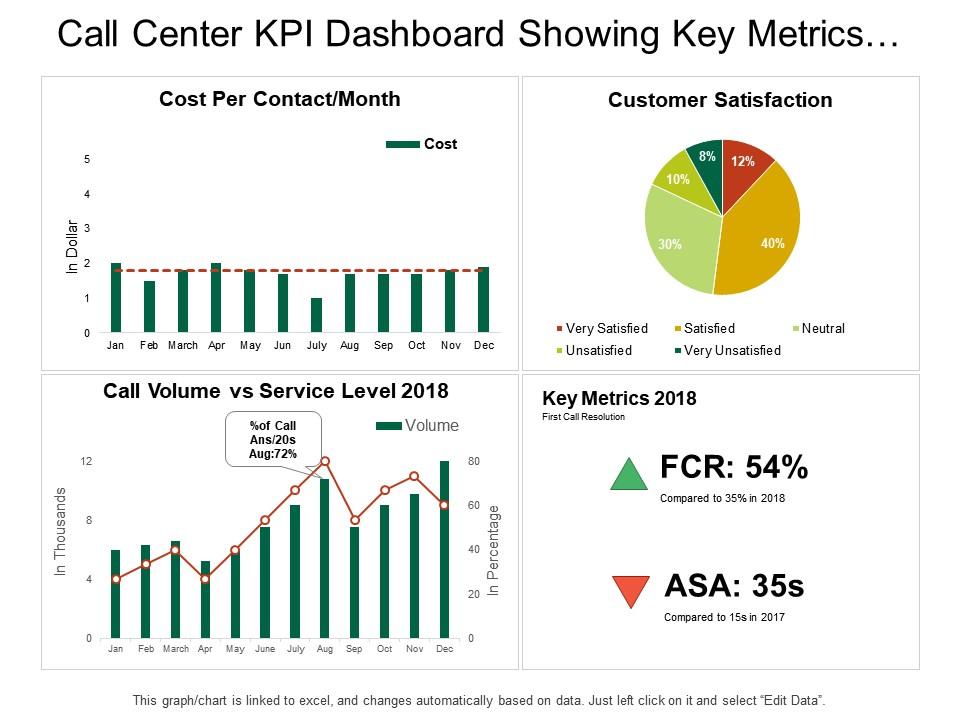
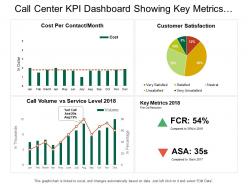
Call center kpi dashboard snapshot showing key metrics customer satisfaction

Rating:
90%
Call center kpi dashboard snapshot showing key metrics customer satisfaction
Slide 1 of 6

or

Favourites Favourites

Try Before you Buy Download Free Sample Product

Audience Impress Your
Audience
Editable 100%
Editable
Time Save Hours
of Time
The Biggest Sale is ending soon in
0
0
:
0
0
:
0
0
Rating:
90%
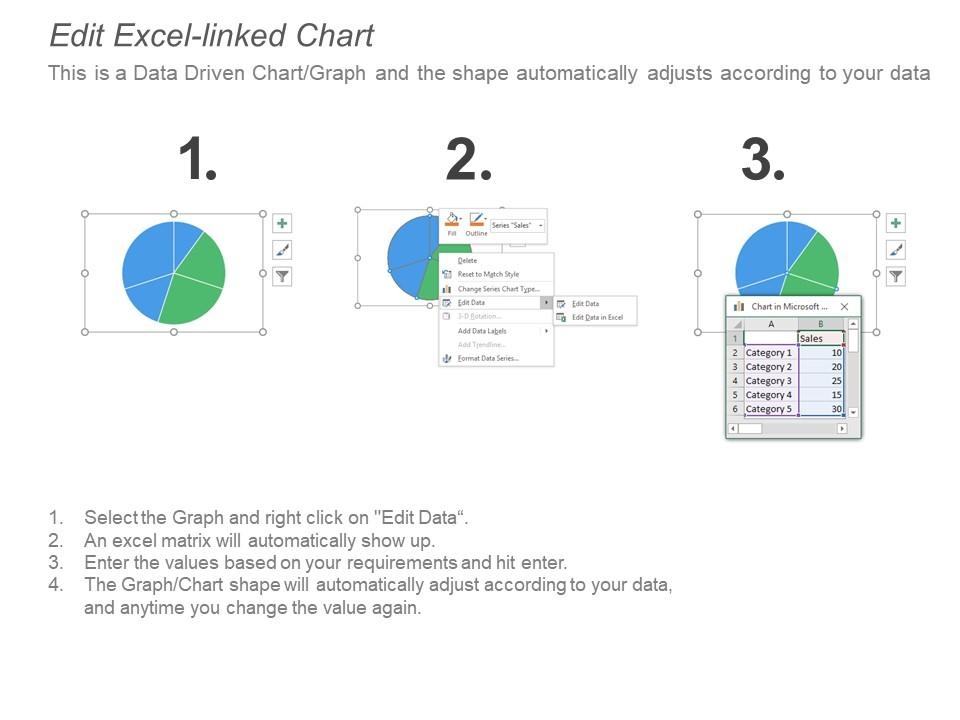
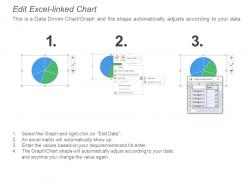
Introducing call center kpi dashboard snapshot showing key metrics customer satisfaction presentation template. Slide designs quality does not deflect when opened on a wide screen show. Inconvenience free fuse of tweaked shading, content and illustrations. Slide incorporates instructional slides to give direction to change the graphical substance. Spare the presentation graphics in JPG or PDF organize. Successfully valuable for the systems administration experts, mediators and the procedure architects, it administrators, data innovation firms. Format slide with various stages or hubs are accessible. Simplicity of download.

FAQs for Call center kpi dashboard snapshot showing key

Essential call center KPIs include first call resolution rate, average handle time, customer satisfaction scores, agent utilization rates, and call abandonment percentages. These metrics streamline performance monitoring by identifying bottlenecks, optimizing resource allocation, and enhancing customer experiences, with many organizations finding that strategic KPI combinations ultimately deliver improved operational efficiency and competitive advantage.

Real-time data visualization enhances call center decision-making by providing instant visibility into performance metrics, queue lengths, agent availability, and customer satisfaction scores through dynamic dashboards and alerts. This immediate access enables managers to quickly redistribute resources, adjust staffing levels, and resolve bottlenecks as they occur, ultimately delivering faster response times and improved customer experiences.

Customer satisfaction score (CSAT) serves as a primary indicator of call center effectiveness, measuring how well agents resolve issues, communicate clearly, and deliver positive customer experiences. This metric directly correlates with business outcomes like customer retention and revenue growth, with many organizations finding that higher CSAT scores translate into reduced churn rates, increased loyalty, and ultimately stronger competitive positioning in the marketplace.

A call center KPI dashboard helps reduce AHT by providing real-time visibility into call patterns, agent performance metrics, and customer interaction data, enabling managers to identify bottlenecks and optimization opportunities quickly. Through automated tracking and analytics, supervisors can streamline agent workflows, enhance training programs, and implement strategic interventions, ultimately delivering faster resolutions and improved operational efficiency.

Strategies to improve FCR rates include comprehensive agent training, robust knowledge management systems, advanced call routing, real-time coaching tools, and integrated customer data platforms. Through these approaches, call centers streamline issue resolution by equipping agents with complete information, connecting customers to specialized experts, and enabling immediate access to account histories, ultimately delivering faster resolutions and enhanced customer satisfaction.

Employee engagement metrics integrate into call center dashboards through satisfaction surveys, absenteeism rates, training completion percentages, peer feedback scores, and performance improvement tracking. These metrics enable managers to identify disengaged agents early, streamline coaching interventions, and enhance overall team morale, with many call centers finding that engaged employees deliver significantly better customer experiences and reduced turnover costs.

Call volume trend displays should include hourly, daily, weekly, and monthly views with clear peak identification, color-coded severity levels, and comparative overlays showing year-over-year patterns. These visualizations enhance workforce planning by enabling predictive staffing, resource optimization, and proactive capacity management, with many contact centers finding that trend-based dashboards reduce wait times and improve operational efficiency significantly.

Call abandonment rate directly impacts customer experience by creating frustration, reducing satisfaction, and damaging brand loyalty when customers hang up before reaching agents. High abandonment rates signal insufficient staffing or inefficient processes, leading to lost sales opportunities, decreased customer retention, and negative word-of-mouth, with many organizations finding that reducing abandonment rates by even small percentages significantly improves customer satisfaction scores and revenue.

Effective call center KPI dashboard tools include Tableau, Power BI, Salesforce Analytics, Zendesk Explore, and Five9 Analytics, offering real-time monitoring and comprehensive reporting capabilities. These platforms streamline performance tracking by integrating multiple data sources, automating report generation, and providing customizable visualizations, with many organizations finding that strategic dashboard implementation enhances operational efficiency and delivers faster decision-making across customer service teams.

Predictive analytics forecasts call center performance by analyzing historical data patterns, seasonal trends, agent productivity metrics, and customer behavior indicators to predict call volumes, wait times, and staffing needs. Through machine learning algorithms, call centers can anticipate peak periods, optimize resource allocation, and proactively adjust schedules, ultimately delivering improved service levels and operational efficiency.

Tracking SLAs significantly enhances operational effectiveness by providing clear performance benchmarks, identifying bottlenecks in real-time, enabling proactive resource allocation, and maintaining consistent service quality standards. Through automated SLA monitoring, call centers streamline workflow optimization, reduce response times, and improve customer satisfaction rates, while managers gain actionable insights that ultimately deliver competitive advantage and operational efficiency.

Call center KPI dashboards can be customized through role-based views, personalized metrics selection, adjustable time frames, and stakeholder-specific visualizations that highlight relevant performance indicators. Agents focus on individual productivity metrics, supervisors monitor team performance and quality scores, while executives track strategic KPIs like customer satisfaction and operational costs, ultimately delivering targeted insights that enhance decision-making across all organizational levels.

Maintaining data accuracy in KPI dashboards faces challenges including data silos across multiple systems, inconsistent formatting standards, real-time synchronization delays, manual entry errors, and varying data definitions between departments. These issues can lead to conflicting metrics and unreliable reporting, with many call centers finding that standardized data governance protocols and automated integration tools significantly enhance dashboard reliability and decision-making confidence.

KPI dashboards identify training needs by tracking performance metrics like average handle time, first call resolution rates, customer satisfaction scores, and agent adherence to scripts. Through real-time analytics, managers can pinpoint skill gaps across individual agents or teams, enabling targeted coaching programs that enhance service quality and operational efficiency while reducing training costs.

**INPUT**: What is the impact of technology, such as AI and chatbots, on traditional call center KPIs? **OUTPUT**: AI and chatbots significantly transform traditional call center KPIs by reducing average handle time, improving first-call resolution rates, and enabling 24/7 availability while shifting focus toward complex problem-solving metrics. These technologies streamline routine inquiries, enhance agent productivity, and deliver improved customer satisfaction scores, with many organizations finding that human agents can concentrate on high-value interactions requiring empathy and strategic thinking. [Word count: 60 words]

Ratings and Reviews

90% of 100
Review Form
Write a review
Most Relevant Reviews
  1. 100%

    by Cornelius Alexander

    Much better than the original! Thanks for the quick turnaround.
  2. 80%

    by David Snyder

    Illustrative design with editable content. Exceptional value for money. Highly pleased with the product.

2 Item(s)

per page: