

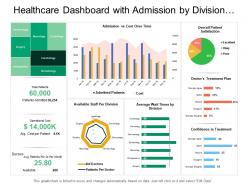
Healthcare dashboard with admission by division and overall patient satisfaction





Try Before you Buy Download Free Sample Product
 Impress Your
Audience
 100%
Editable
 Save Hours
of Time


Highlight areas of disparity with our Healthcare Dashboard With Admission By Division And Overall Patient Satisfaction. Guide folks on how to eliminate them.
People who downloaded this PowerPoint presentation also viewed the following :
Healthcare dashboard with admission by division and overall patient satisfaction with all 6 slides:
Allow them to have a ball with our Healthcare Dashboard With Admission By Division And Overall Patient Satisfaction. They will find each one absolutely enjoyable.


FAQs for Healthcare dashboard with admission by division and
Honestly, start with patient stuff - readmission rates, infections, satisfaction scores. That's what actually matters at the end of the day. Then add operational metrics like bed occupancy and ER wait times (those always get leadership's attention). Financial ones are obvious - cost per patient, budget variances, revenue cycle. Staff turnover and overtime hours are huge too since burned out nurses affect everything else. I'd pick maybe 5-6 metrics that your bosses already track religiously, then expand. Don't go crazy with 20 different dashboards right off the bat.
Honestly, visualizations are total game-changers because they make complex healthcare data actually make sense to different people. Doctors want patient trend charts and risk stuff they can scan quickly. Administrators? They're all about operational dashboards - bed usage, costs, that kind of thing. Board members just need those high-level metrics they can understand in like 30 seconds (let's face it, their attention spans aren't great). The trick is figuring out how each group thinks and what decisions they're trying to make. I always start by asking what questions they need answered, then build charts that make the answers super obvious.
Dude, real-time dashboards are clutch for catching stuff before it goes sideways. Patient vitals and lab results update instantly, so you'll spot someone crashing or med errors right when they happen. Way better than finding out hours later buried in paperwork. You get live feeds on bed counts, how swamped your staff is, critical changes - the whole picture. Honestly beats the old system by miles. The trick though? Your team has to actually watch the damn things consistently. Data sitting there unwatched doesn't help anyone, you know?
Honestly, these dashboards are lifesavers for compliance stuff. Instead of scrambling last minute when audits hit, they automatically pull data from all your systems and format everything exactly how HIPAA, CMS, or Joint Commission wants it. Real-time audit logs mean you're always ready for inspections - no more panic mode. The automated reporting schedules are clutch too. I swear, once you set this up you'll wonder how you survived doing it all manually. Quality metrics, safety reports, audit trails - it handles the whole mess without you having to think about it.
So basically, put the urgent stuff right at the top and use colors that make sense - red for critical, green for good, you know? Don't cram everything together because doctors are already swamped and cluttered screens just make things worse. Group similar info so it flows logically. Oh, and definitely get actual healthcare workers to test it early - designers miss so much stuff that would be obvious to someone actually using it day-to-day. Stick with medical terms they already know rather than trying to reinvent the wheel. Start simple with wireframes before you build anything fancy.
So basically, these dashboards show you everything happening with your patients right now - readmission rates, how fast treatments are working, all that stuff in one spot. Way better than scrolling through a million Excel files, trust me on that one. The cool part is spotting patterns fast, like which treatments actually work or if patients are slipping through the cracks somehow. Just make sure your data updates automatically so you're not working off old info. Oh, and set up alerts for the important stuff - catches problems early before they blow up.
Okay so you definitely need role-based access controls - basically only let people see what they actually need for their job. Multi-factor authentication is a must too. All your data has to be encrypted whether it's moving around or just sitting there, HIPAA doesn't mess around with that stuff. Set up audit logs so you can track who's looking at what (super helpful if something goes wrong). Session timeouts are honestly lifesavers because people constantly walk away from unlocked computers. Oh and run security tests regularly - pen testing and all that. Honestly just imagine it's your own medical info up there.
Mobile dashboards have to be way more streamlined since you're working with tiny screens. Everything gets bigger, more focused - can't just cram in data tables like on desktop. Navigation's totally different too, lots of swiping instead of mouse stuff. Honestly? The constraints actually make mobile versions cleaner most of the time. Desktop lets you get lazy with cramming everything in multiple windows. For mobile, you really have to think about what doctors need right away. Oh and definitely test it with actual physicians using just their thumbs - you'll catch so many issues that way.
Honestly, data integration is a game changer for dashboards. You get the full picture instead of just fragments. Combining EHR data with lab results and wearable metrics lets you catch stuff you'd never see otherwise - like when someone's smartwatch heart rate paired with their recent bloodwork shows early warning signs. Makes all the difference. Just make sure your integration setup is solid first, or you'll end up with clean-looking chaos (been there). The tricky part is keeping data quality consistent across different sources, but once you nail that, the insights you can pull are pretty incredible.
So you want to build predictive alerts right into your dashboard - stuff like readmission risk, sepsis warnings, patient deterioration scores. The trick is making sure these actually trigger workflow changes, not just sit there as fancy numbers. Set up automated alerts that ping care teams or update protocols when thresholds get hit. Machine learning is cool and all, but honestly basic risk scoring works great too. Main thing? Make your predictions actionable. I've seen too many dashboards with "interesting" data that nobody actually uses to change patient care.
Honestly, I'd start with role-based widget libraries - let each department drag and drop what they actually need. Nursing wants patient acuity and staffing ratios right up front. Admin? They're obsessing over bed utilization and financial stuff. Custom alert thresholds are clutch because what freaks out pharmacy won't even register with the C-suite, you know? Department-specific color coding helps too, plus letting people resize and move panels around however they want. Survey each team about their top 5 daily metrics first though - build your templates from real data, not guesswork.
So basically you'd break down your patient data by demographics - race, income, zip codes, insurance types, all that stuff. Then you can actually see the patterns emerge. Like maybe certain groups are waiting way longer for appointments or getting worse outcomes. Honestly kind of depressing when you first dig into it, but super important. Set some equity targets once you spot the gaps. The smart move is getting your dashboard to automatically flag new disparities as they pop up. Way better than finding out about problems months later buried in some random report nobody reads.
Ugh, data silos are the worst - everything's scattered across different systems that hate talking to each other. Your EHRs, lab results, billing stuff... none of it matches up properly. Then you've got people fat-fingering entries (saw someone list a patient's weight as their birth year once, which was fun). Missing records happen constantly too. I'd set up some automated checks to catch the obvious mistakes, plus do regular clean-up audits. Oh, and make sure you have a solid game plan for when things inevitably go sideways with your data feeds.
Honestly, dashboards are a game-changer for telehealth. All your patient data from home devices gets pulled into one spot - vital signs, medication tracking, symptoms, everything. No more juggling ten different apps (which was driving me crazy before). The alert system is clutch though. When someone's readings go wonky, you get pinged immediately so you can actually do something before they end up in the ER. Your patients can log in and see their own numbers too, which keeps them way more involved. Just make sure you're setting those alert thresholds based on each person's normal ranges, not some generic baseline.
User feedback is your roadmap for what's broken vs what works. Clinicians will straight up tell you where the pain points are - like when alerts get buried or they can't find patient data during rounds. Some of the best updates I've seen came from frustrated nurses who weren't shy about complaining (and honestly, good for them). Set up feedback loops through surveys or casual conversations. User sessions work too, though those can feel formal. The biggest mistake? Not acting on what people tell you. Do that and they'll stop bothering to share anything useful.
-
Excellent design and quick turnaround.
-
Awesomely designed templates, Easy to understand.