

Implementation of artificial intelligence powerpoint presentation slides





Try Before you Buy Download Free Sample Product
 Impress Your
 Audience
 100%
100% Editable
 Save Hours
 of Time


Introducing Implementation Of Artificial Intelligence PowerPoint Presentation Slides. The presentation contains various templates like business intelligence market overview, architecture framework, data design, data integration design, BI design, advanced final output results, KPI metrics, and dashboards. Other important information like industries that use BI and critical drivers is also depicted in our artificial intelligence PPT deck. Display valuable business insights with the help of our professionally designed operational intelligence PPT slideshow. This commercial intelligence presentation aptly showcases how BI assists in developing business. You can convey your BI design and implementation in a compact manner with our handy business intelligence PowerPoint diagrams. Take the assistance of industrial AI PPT layouts to demonstrate sophisticated subjects like information architecture and dimensional modeling easily. This integrated business planning PowerPoint theme also sheds light on advanced analytics techniques and methods. Download the artificial intelligence PowerPoint slideshow to represent your plan to expand business horizons.
People who downloaded this PowerPoint presentation also viewed the following :
Content of this Powerpoint Presentation
Slide 1: This slide introduces Implementation of Artificial Intelligence. State Your Company Name and begin.
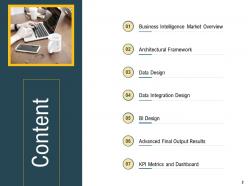
Slide 2: This slide shows Content describing- Business Intelligence Market Overview, Architectural Framework, Data Design, etc.
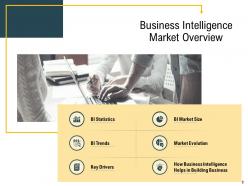
Slide 3: This slide shows Business Intelligence Market Overview.
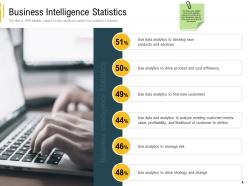
Slide 4: This slide covers statistics about the BI application usage by the companies for data management.
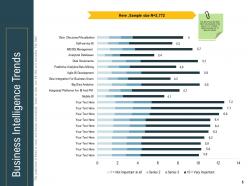
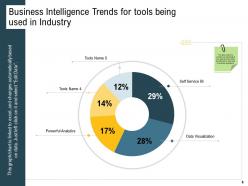
Slide 5: This slide presents that which trend has importance on the scale of 1 to 10 where, 1 being the lowest and 10 being the highest.
Slide 6: This slide covers the number and percentage of the users that are include BI software’s in their suite of business applications.
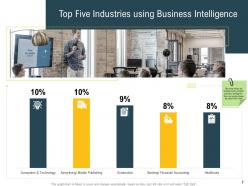
Slide 7: This slide displays the leading sector using the business intelligence. User can easily change the data in this slide
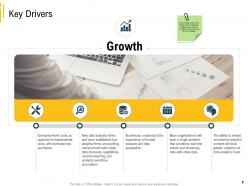
Slide 8: This slide represents Key Drivers with related icons.
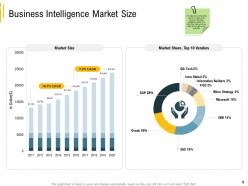
Slide 9: This slide showcases the market size for 10 years & top vendors in Business Intelligence market. It’s a data driven slide which can easily be changed by the customer
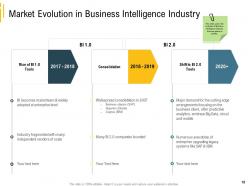
Slide 10: This slide covers the evolution of Business Intelligence Industry from one phase to another.
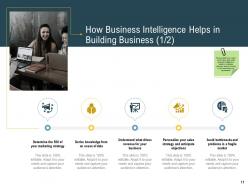
Slide 11: This slide shows How Business Intelligence Helps in Building Business.
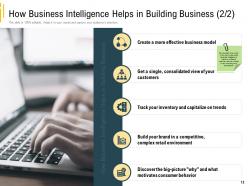
Slide 12: This is another slide showing How Business Intelligence Helps in Building Business.
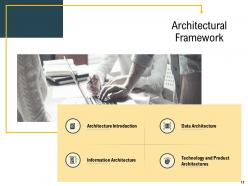
Slide 13: This slide presents Architectural Framework describing Architecture Introduction, Information Architecture, Data Architecture, etc.
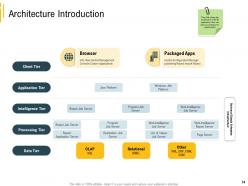
Slide 14: This slide displays the architecture of the BI application.
Slide 15: This slide depicts a framework with the Technologies and components of an information architecture system. User can alter according to his requirements
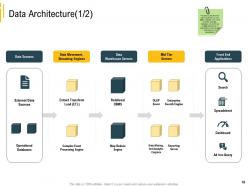
Slide 16: This slide covers that how data is governed i.e. how data is collected, and how it is stored, arranged, integrated, and put to use in data systems and in organizations. User can edit according to his requirements
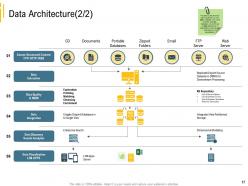
Slide 17: This slide covers that how data is governed i.e. how data is collected, and how it is stored, arranged, integrated, and put to use in data systems and in organizations. User can edit according to his requirements
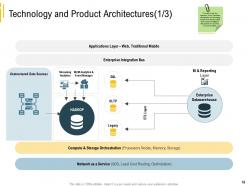
Slide 18: This slide presents the organizing data, information management and technology components that are used to build business intelligence (BI) systems for reporting and data analytics.
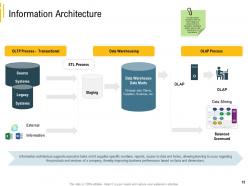
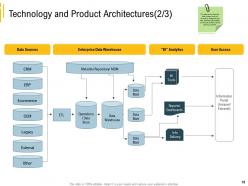
Slide 19: This slide displays that how data is taken from the sources to warehouse and then performing BI analytics on the data so that it can be used by customer.
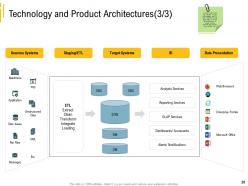
Slide 20: This slide shows that the data is extracted from the source systems with ETL layer and transfer into data bases system and on that stored data several BI analytics tools are performed so that we can get presentable data.
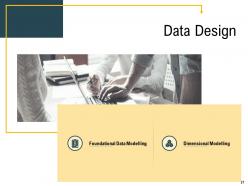
Slide 21: This slide presents Data Design describing- Foundational Data Modelling, Dimensional Modelling, etc.
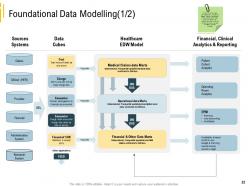
Slide 22: This slide displays the logical inter-relationships and data flow between different data elements and documents the way data is stored and retrieved also represent what data is required and what format is to be used for different business processes.
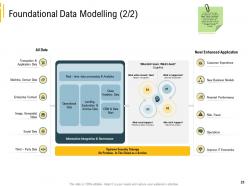
Slide 23: This slide shows the logical inter-relationships and data flow between different data elements and documents the way data is stored and retrieved also represent what data is required and what format is to be used for different business processes.
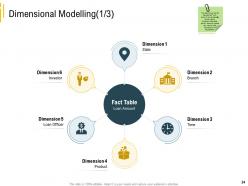
Slide 24: This slide showcases that the required fact “loan amount’ can be calculated across various dimensions like state, branch, time and product etc. user can edit according to his requirements
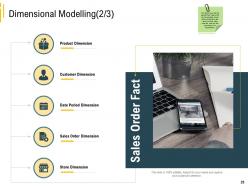
Slide 25: This slide shows that the required fact “sales order’ can be calculated across various dimensions like store, product, sales order etc. user can edit according to his requirements
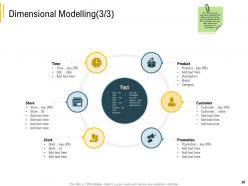
Slide 26: This slide presents the dimensional modelling of the tables where PK is primary key of the specific table and FK is the foreign key in fact table. User can edit according to his requirements
Slide 27: This slide displays Data Integration Design with related imagery.
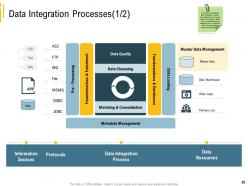
Slide 28: This slide covers effective Data Integration process, with extensive planning and design that results in better and more flexible business intelligence and a framework that is future-proofed for additional requirements.
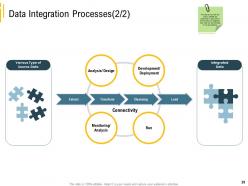
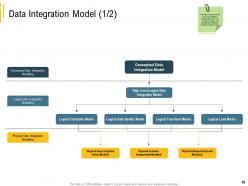
Slide 29: This slide shows that how various activities are performed on data and the transformed into integrated data. User can edit according to his requirements
Slide 30: This slide covers the three main data integration modelling layers and how conceptual, logical, and physical data integration models are broken down.
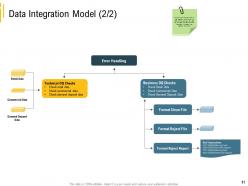
Slide 31: This slide shows that data quality & data integration model contain the ability to produce a clean file, reject file, and reject report that would be instantiated in a selected data integration technology.
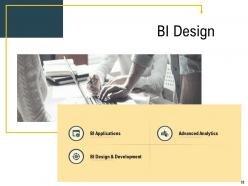
Slide 32: This slide presents BI Design describing- BI Design & Development, Advanced Analytics, BI Applications, etc.
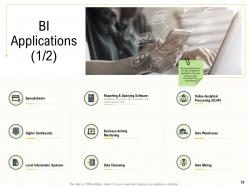
Slide 33: This slide displays BI Applications describing- Data Cleansing, Spreadsheets, Digital Dashboards, etc.
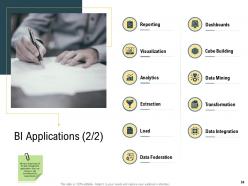
Slide 34: This is another slide shows BI Applications describing- Data Mining, Data Integration, Visualization, etc.
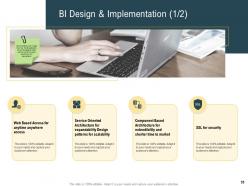
Slide 35: This slide presents BI Design & Implementation.
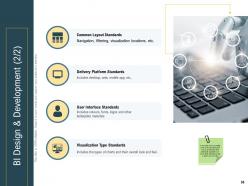
Slide 36: This slide shows BI Design & Development.
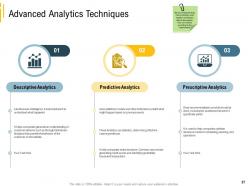
Slide 37: This slide presents Advanced Analytics Techniques like Descriptive Analytics, Predictive Analytics, Prescriptive Analytics, etc.
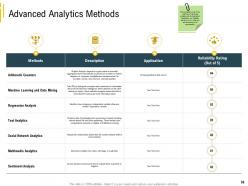
Slide 38: This slide displays Advanced Analytics Methods in tabular form.
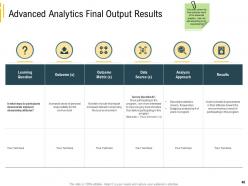
Slide 39: This slide shows Advanced Analytics Final Output Results.
Slide 40: This slide covers the final outcome result of the advanced analytics. User can edit according to his requirements '
Slide 41: This slide shows Business Intelligence Kpis & Dashboard.
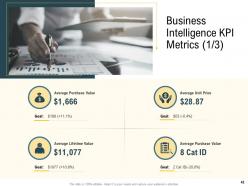
Slide 42: This is another slide showing Business Intelligence KPI Metrics.
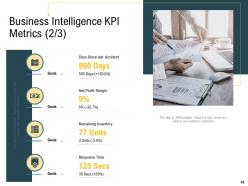
Slide 43: This slide presents Business Intelligence KPI Metrics with related imagery.
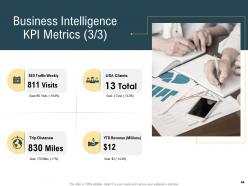
Slide 44: This slide represents Business Intelligence KPI Metrics.
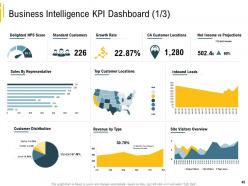
Slide 45: This slide showcases Business Intelligence KPI Dashboard.
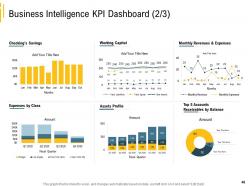
Slide 46: This slide shows Business Intelligence KPI Dashboard.
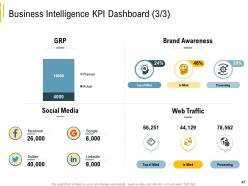
Slide 47: This slide presents Business Intelligence KPI Dashboard.
Slide 48: This slide displays Implementation of Artificial Intelligence Icons.
Slide 49: This slide is titled as Additional Slides for moving forward.
Slide 50: This is About Us slide to show company specifications, etc.
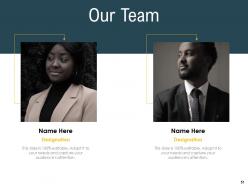
Slide 51: This is Our Team slide with names and designation.
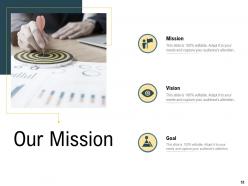
Slide 52: This is Our Mission slide. State your firm's mission here.
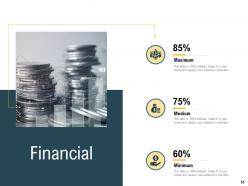
Slide 53: This is a Financial slide. Show your finance related stuff here.
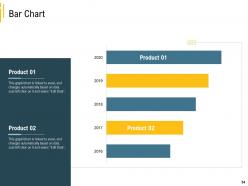
Slide 54: This slide shows Bar Chart with two products comparison.
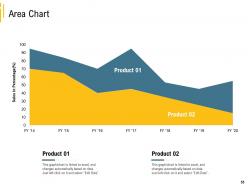
Slide 55: This slide presents Area Chart with two products comparison.
Slide 56: This is a Thank You slide with address, contact numbers and email address.
Implementation of artificial intelligence powerpoint presentation slides with all 56 slides:
Use our Implementation Of Artificial Intelligence Powerpoint Presentation Slides to effectively help you save your valuable time. They are readymade to fit into any presentation structure.





FAQs for Implementation of artificial intelligence
Honestly, garbage data will kill your AI project before it even starts. Get your team sorted first - you need tech people AND folks who actually understand the business side. The software cost? That's nothing compared to integration headaches and training time (I've seen this tank so many budgets). Your employees might hate the whole thing if you don't think about company culture early. Start small though - pick one pilot project where you can actually measure results. Something concrete that'll shut up the skeptics when it works. Then scale from there once you've got proof it's worth it.
Honestly, measuring AI ROI is pretty straightforward once you break it down. Track the obvious stuff first - how much you're saving on labor costs, faster processing times, fewer mistakes. Revenue changes matter too - are you seeing more sales or keeping customers longer? The productivity gains are usually where you see the biggest wins though. Don't ignore how your team feels about it either, because when AI handles the boring work, people are way happier. Set up some basic dashboards to check these numbers monthly. That way you've got actual data to show your boss instead of just saying "trust me, it's working."
Look, bias is the big one - if your training data sucks, your AI will discriminate like crazy. Privacy matters too though. People want to know what you're doing with their info, which honestly makes sense. The whole "black box" thing is such a nightmare but try making decisions explainable when you can. Oh and definitely figure out who's responsible when stuff breaks. I'd make some kind of ethics checklist your team actually uses at each milestone instead of just ignoring it.
So AI basically gives every industry its own set of superpowers. Healthcare gets faster diagnosis and drug discovery - pretty huge when you think about it. Finance companies use it to catch fraud and do algorithmic trading. Retail? They're all about those personalized recommendations and keeping inventory sorted. Manufacturing can actually predict when machines will break before it happens, which saves them tons of money. Even farmers are using it now to monitor crops and predict yields (I had no clue about that one until recently). You just gotta look at what boring, repetitive stuff in your field could use some smart automation.
Honestly, just start with AWS SageMaker or Google AI Platform - they do all the annoying infrastructure stuff for you. Python's basically required, usually with TensorFlow or PyTorch, but fair warning: the learning curve sucks if you're starting from scratch. DataRobot's way more beginner-friendly though. Oh, and if you're doing any language processing work, Hugging Face has amazing pre-trained models that'll save you tons of time. Really depends on your budget and how technical your team is. I'd say prototype on a managed platform first, then maybe move to something custom later if you need it.
Start with data minimization - seriously, only grab what you actually need for your models. Encrypt everything in transit and at rest. Set up strict access controls too. Regular audits are non-negotiable because this stuff changes fast and you can't just ignore it. For super sensitive data, look into differential privacy or federated learning - though honestly, federated learning can be a pain to set up. The whole privacy thing needs to be baked in from the start, not slapped on later. First step? Do a proper audit of what data you've got sitting around right now.
Dude, training is literally everything when it comes to rolling out AI at work. Skip it and your team will either hate the new tools or just pretend they don't exist. I've watched this train wreck happen at like three different companies now. Start the training super early - way before you actually launch anything. Make sure people understand not just the "how" but the "why" behind using these tools. Oh, and don't do some lame one-day workshop and call it done. People need ongoing support or they'll give up the second something goes wrong.
Honestly, communication is everything here. Explain WHY you're doing this from the start - like how it'll actually help them, not replace them. Too many companies just drop these changes without any context and wonder why everyone freaks out. Get your key people involved early so they feel like they're part of it instead of victims. Training matters too, obviously. Most people just hate change because they don't know what to expect. Be super transparent about timelines and what's actually happening. Oh, and address the scary stuff head-on - don't pretend their concerns aren't real. That backfires every time.
Honestly, most people jump in without figuring out what they actually want to accomplish first. Data quality is huge too - garbage in, garbage out, you know? Don't pick AI just because it's the hot thing right now (I see this ALL the time). Users hate being surprised with new systems, so loop them in early. Also watch out for biased training data or your results will be completely off. Change management is brutal - people freak out about stuff they don't get. Start with something small, get everyone on board first, and make sure your current setup can even handle what you're building.
Look for stuff that's actually broken in your workflows first - don't just throw AI at random things. I'd start small with pilot projects instead of going all-in (seen too many companies crash and burn that way). Repetitive tasks are usually your best bet, plus anything involving data analysis or customer service. Your team needs decent training though, and honestly your data has to be clean or you're screwed. Oh, and set up some way to measure if it's actually working before you expand. Baby steps basically - prove it works in one area, then grow from there.
Honestly, pick metrics that actually match what you're trying to accomplish. Classification stuff? Go with accuracy, precision, recall, F1-score. Regression? MAE, RMSE, R-squared work well. But here's the thing - technical numbers are only part of it. You need to track real impact too: user happiness, speed improvements, money saved, whatever your AI is supposed to fix. Also watch out for bias issues (learned that one the hard way). Start with maybe 2-3 metrics your team actually cares about, then add more later.
Start with making people feel safe to mess around and fail - nobody's going to try new stuff if they're scared of getting roasted for mistakes. Regular brainstorming sessions help, plus give teams actual time to play with AI tools. Oh, and definitely celebrate the attempts that flop too. Leadership needs to visibly use AI themselves and share what they're learning (or struggling with, honestly). Begin with small pilot projects so folks can build up confidence slowly. The whole "do as I say not as I do" thing never works anyway. You want people seeing their bosses fumbling through ChatGPT prompts just like everyone else.
Honestly, your job will probably change more than disappear completely. AI's taking over the boring, repetitive stuff while pushing us toward creative and strategic work. It's kinda like how smartphones killed flip phones but created whole new industries, you know? Focus on what makes you uniquely human - reading people, solving messy problems, building relationships. Those skills are still gold. Start figuring out which parts of your job AI could actually help with versus the stuff only you can handle. Stay curious and keep learning new things. That's really the best defense against getting left behind.
Look, regulatory stuff means you can't just wing it and add compliance later - gotta bake it in from the start. Data governance, algorithmic transparency, audit trails... yeah it's a pain and definitely slows things down. But trust me, way better than dealing with regulators breathing down your neck later. Each region has its own weird rules too, which honestly makes going global a nightmare. Map out what regulations you're dealing with first, then build your whole plan around those constraints. Sounds backwards but it actually works way better.
Continuous monitoring is your best friend here - watch performance metrics, data drift, all that stuff in real-time. Set up retraining on a schedule, like monthly or quarterly depending how fast your data changes. Version control will save your ass (trust me on this one). Test everything in staging first, obviously. Keep your training data current so it actually reflects what's happening now. Oh, and have a rollback plan ready because new models can totally bomb. Automated alerts for when performance drops are clutch too.
-
Innovative and attractive designs.
-
Design layout is very impressive.
-
Good research work and creative work done on every template.
-
Easily Understandable slides.
-
Informative design.
-
Innovative and Colorful designs.
-
Commendable slides with attractive designs. Extremely pleased with the fact that they are easy to modify. Great work!
-
Informative design.
-
Presentation Design is very nice, good work with the content as well.
-
The Designed Graphic are very professional and classic.
-
Page:
- You're currently reading page 1
- Page 2
-
