


Integration maturity model






Try Before you Buy Download Free Sample Product
 Impress Your
 Audience
 100%
100% Editable
 Save Hours
 of Time


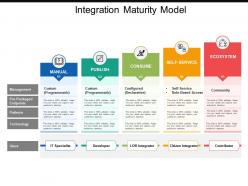
If you are finding troubles in laying out a PPT presentation on integration maturity model within a constrained time? Try not to freeze! SlideTeam is one of the PowerPoint templates organizations who has thought of a predesigned integration PowerPoint template slide created by skilled illustrations experts’ group. While remembering the customer necessities, our architects have made this integration architecture maturity model presentation slide design. This stunning service integration maturity model PPT slide design includes the symbol of an opened book, paper with a pen, consume, screen, and communication cycle has been conveyed to make this exceptional PPT slides that will help you in snatching the attention of the watchers. The integration template design reflects five phases which are manual, publish, consume, self-service, and ecosystem. Each stage has been given enough space with the goal that you can depict each dimension completely. You can utilize this layout to clarify the idea of a business development model, and integration maturity framework development. Hustle just a bit and download this editable integration maturity model PowerPoint template slide. Display good balance with our Integration Maturity Model. You will always appear level headed.
People who downloaded this PowerPoint presentation also viewed the following :
Content of this Powerpoint Presentation
Description:
The image presents an "Integration Maturity Model" PowerPoint slide that outlines the progression of integration practices in an organization. It's divided into five stages, each represented by a different color and number, indicating a sequential advancement in integration maturity:
1. MANUAL (Blue): The first stage is manual, characterized by custom (programmatic) management, pre-packaged endpoints, and technology, with IT Specialists as the primary users.
2. PUBLISH (Green): The second stage moves towards publishing, with still custom (programmatic) but more advanced management. Developers are the key users in this phase.
3. CONSUME (Light Green): At this stage, the model shifts to consumption, where configurations become declarative. Line of Business (LOB) Integrators are the users here, indicating a shift towards non-technical personnel handling integration.
4. SELF-SERVICE (Yellow): The fourth stage is self-service, highlighting self-service and role-based access. It opens up integration to Citizen Integrators, suggesting that business users with no formal IT training are able to perform integration tasks.
5. ECOSYSTEM (Red): The final stage is the ecosystem, which emphasizes community involvement. Contributors, who could be external partners or customers, are actively involved, indicating a mature, open, and collaborative integration environment.
Across the bottom of the slide are categories that change with each stage: Management, Patterns, Technology, and Users. As the model progresses, the approach to integration becomes more open and decentralized, with a broader range of users engaging with the technology.
Each stage's description box also includes a note stating that the slide is "100% editable," allowing the presenter to customize the information according to their specific context.
Use Cases:
Integration Maturity Models are crucial for organizations to streamline processes. Here are seven sectors where this slide could be particularly relevant:
1. Software Development:
Use: Mapping the evolution of software integration practices.
Presenter: Chief Technology Officer.
Audience: Software Development Teams, Product Managers.
2. Telecommunications:
Use: Demonstrating stages of network integration and management.
Presenter: Network Architect.
Audience: Engineering Teams, Operational Managers.
3. Banking and Finance:
Use: Outlining the advancement in financial systems integration.
Presenter: Chief Information Officer.
Audience: IT Department, Compliance Officers.
4. Healthcare:
Use: Showing the progress in healthcare information systems integration.
Presenter: Healthcare IT Specialist.
Audience: Hospital Administrators, Medical Staff.
5. Retail:
Use: Depicting the integration of retail management systems from manual to AI-driven.
Presenter: Retail Systems Manager.
Audience: Store Managers, IT Teams.
6. Supply Chain and Logistics:
Use: Illustrating integration levels in supply chain management software.
Presenter: Logistics Director.
Audience: Warehouse Managers, Distribution Partners.
7. Automotive:
Use: Explaining integration stages in manufacturing and design systems.
Presenter: Manufacturing Systems Engineer.
Audience: Production Teams, Design Engineers.
Integration maturity model with all 5 slides:
Add some fizz with our Integration Maturity Model. Then Just sit back, relax, have a coke.

FAQs for
So integration is basically finding area under curves and adding up quantities over time or space. The fundamental theorem of calculus connects it to derivatives, plus you've got substitution methods for trickier problems. You see this stuff everywhere though - calculating distance from speed data, finding volumes of weird shapes, figuring out work from changing forces. Population models use it too. Engineers are constantly doing stress analysis and fluid dynamics with integrals. Honestly, even your car's odometer works on these principles! I'd start with basic area problems. Makes the whole concept way less abstract.
So indefinite integrals give you a whole family of functions - that's why you get the +C. Definite integrals? Just one number. With indefinite, you're finding the antiderivative, so you get a function back. Definite integrals calculate area under a curve between two points, which gives you an actual value. Think of it like... indefinite is the recipe, definite is the cake you actually made (okay that analogy's kinda weird but whatever). For homework stuff, definite integrals will give you concrete answers you can use in other calculations.
Dude, you really need solid integration skills before tackling differential equations. Variable separation? You're integrating both sides. Exact equations mean finding that potential function through integration. Integration by parts shows up everywhere too - honestly it's kinda annoying how often. Higher-order stuff requires integrating multiple times, and partial fractions becomes your best friend when dealing with messy rational functions. I learned this the hard way my first time around. Trust me, get comfortable with integration first or you'll be pulling your hair out later trying to solve DEs.
Integration comes up everywhere in finance, trust me. You'll need it for present value calculations, risk stuff, and working with probability distributions. Cash flow modeling? That's where integration really shines - helps you find total accumulated values and handle continuous compounding. Options pricing models like Black-Scholes are basically impossible without it. Same goes for calculating Value at Risk from probability functions. Honestly, the math can feel overwhelming at first, but once you get the hang of it, financial modeling makes way more sense. Start with basic NPV problems using continuous discounting - good foundation for the trickier concepts later.
Oh man, integration is literally everywhere in data stuff. You're constantly using it for probability distributions - finding areas under curves to get probabilities. Machine learning optimization? Yep, integration. Statistical inference when you're deriving likelihood functions? Also integration. The wild part is you probably don't even notice half the time. Continuous random variables, expected values, Bayesian posterior distributions - all need it. Even something as basic as correlation coefficients uses integration behind the scenes. And every time you calculate a p-value from a normal distribution, that's just integration too.
Look, analytical integration is great when you can actually find the antiderivative - gives you perfect, exact answers. But honestly? Most functions in real engineering are messy as hell and don't have clean solutions. That's where numerical methods come in clutch. Sure, you're getting approximations, but with something like Simpson's rule or Gaussian quadrature, you can get crazy accurate results if you pick the right step size. I'd say go analytical when it's simple and obvious. Otherwise, just embrace the numerical approach - that's what most of us end up doing anyway.
You're gonna use integration everywhere in physics, trust me. Real problems don't deal with perfect shapes - you need to find displacement from wonky velocity curves, calculate volumes of irregular objects, stuff like that. Think of it as super-powered addition for smooth functions. Slice everything into tiny pieces and add them up. Start with basic area problems first, then move to physics stuff like centers of mass and electric fields. Oh, and work done by forces that keep changing. It's honestly pretty cool once you get the hang of it.
So basically, you set up equations for your constraints and tell calculus what you want to optimize - could be minimizing costs or maxing out production. The math figures out exactly how to split up your materials, workers, whatever you're working with. Way more useful than those boring textbook examples make it seem! Start with just two variables to get the hang of it first. Once you define what you're optimizing and plug in your limits, the calculus handles all those annoying trade-offs automatically. Honestly saved me so much time when I had competing demands for my budget last semester.
Ugh, the worst part is dealing with subsystems that were never meant to talk to each other. Interface compatibility becomes this huge mess. Data formats don't match up, timing gets weird between components. Real-time stuff makes it ten times harder - works great in testing, then completely dies under actual load. And debugging? Forget about it. Something breaks and you're hunting through like five different subsystems trying to figure out what went wrong. Honestly, just document your interfaces really well from day one and build in monitoring so you can actually see what's happening when it all goes sideways.
Think of integration as zooming out to see the whole story instead of just snapshots. You're measuring total accumulated change - like the area under a curve or how far something actually moved. Pretty cool once you get it. Local bumps and dips get smoothed out, so you can see the real underlying pattern. Whether your function's mostly going up or down over a range becomes super obvious. Oh, and definitely try graphing a function next to its integral sometime - the difference is wild. You'll spot trends and averages way easier than staring at individual points.
Honestly, integration is everywhere in graphics once you notice it. Your computer calculates smooth curves by integrating mathematical functions - that's how it knows the exact path to draw. Anti-aliasing works the same way, figuring out how much of each pixel a shape actually covers so you don't get those awful jagged edges. I used to think calculus was just academic BS until I saw this stuff in action. The math behind curve subdivision is pretty wild when you watch a rendering engine work. Short version: integration is what separates professional-looking graphics from pixelated garbage.
So basically, integration lets you see the full picture instead of just random pieces. You're pulling data from sales, operations, finance, customer stuff - everything talks to each other. Like when you launch a new product, you can actually track how it hits inventory AND customer happiness, not just sales numbers. Way better than the usual "let's hope this works" approach most companies do. You'll catch patterns you'd totally miss otherwise. Honestly, just pick one decision you're stuck on and figure out what data could help. Start there and build up.
Honestly, R and Python are your best bet for data integration stuff - they're solid for combining datasets and running analysis. MATLAB's everywhere if you're doing engineering or physics work. SQL's gonna come up eventually, probably with PostgreSQL or MySQL. Git saves your sanity when collaborating (seriously, version control is a lifesaver). Cloud platforms like AWS are pretty standard now for bigger projects. My advice? Just start with whatever your lab's already using. Yeah, there's a learning curve, but it beats constantly converting files back and forth with everyone else.
So it's kinda like math integration but way cooler - you're taking all these separate pieces and smooshing them together into something bigger. Musicians do this constantly, mixing different instruments and rhythms until you get this amazing harmony. Same with painters combining colors and textures. Honestly, I never thought about art this way until someone pointed it out to me. Both require figuring out how individual parts flow together without feeling choppy. Try listening to your favorite song and picking apart all the layers - it's wild how much stuff is actually happening at once.
So basically, integration smashes those stupid walls between different fields. You get everyone working on the same platform, sharing data and methods. Climate science is a perfect example - biologists, chemists, physicists all have to play nice together or nothing gets solved. The cool thing is you can tackle massive questions that would be impossible for just one discipline. Honestly, some of the most interesting breakthroughs happen at these intersections. Start with small collaborations or shared databases first. Don't go crazy trying to integrate everything at once - build up what actually works.
No Reviews