

Modelos de indicadores-chave de desempenho 3 Powerpoint Slide Show






Try Before you Buy Download Free Sample Product
 Impress Your
Audience
 100%
Editable
 Save Hours
of Time


Faça uma oferta com nosso modelo 3 de indicadores-chave de desempenho Powerpoint Slide Show. Proteja o troféu com suas ideias.
People who downloaded this PowerPoint presentation also viewed the following :
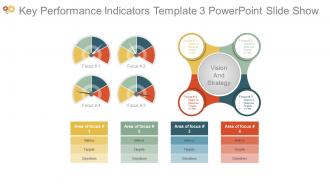
Indicadores-chave de desempenho Modelo 3 Apresentação de slides em PowerPoint com todos os 4 slides:
Certifique-se de que todos os detalhes importantes sejam focalizados com nossa apresentação de slides em PowerPoint do modelo 3 dos indicadores-chave de desempenho. Ser capaz de fornecer um relato exaustivo.

FAQs for Key performance indicators template 3
Focus on revenue growth, customer acquisition cost, and lifetime value first - that trio tells you whether you've got something real or just burning cash. Monthly recurring revenue matters tons for subscription businesses. Churn rate's critical too because what's the point of gaining customers if they're all leaving? I always tell people to obsess over gross margins early on. Cash flow deserves attention since you can't grow if you're constantly broke. Honestly, start simple with these basics before getting fancy with other metrics.
Honestly, I'd start by getting department heads involved in picking their own KPIs - they actually know what moves the needle for their teams. Sales might care about conversion rates, HR about retention, whatever. The trick is making sure those departmental metrics still connect to your bigger company goals somehow. Otherwise you end up with departments doing their own thing (been there, not fun). Map out each department's main functions first, then figure out what success looks like for each one. Don't forget to review these quarterly though - stuff changes and your KPIs should too.
Honestly, charts and dashboards are game-changers for presenting KPI data. Your stakeholders won't have to squint at endless spreadsheet rows anymore. Quick visual stuff like color coding and trend lines? They make it so much easier for everyone to see what's working and what isn't. I've seen too many meetings where people just zone out staring at numbers. But throw up a clean dashboard and suddenly executives actually get excited about the data. Progress bars especially work well for showing targets. You'll turn those boring stats into something people can actually use to make decisions fast.
Don't overcomplicate it - that's where most people mess up. Start with maybe 3-5 metrics that actually matter to your business, not stuff that just looks good on paper. Like, who cares about total page views if your conversion rate sucks? Also make sure someone's actually responsible for updating each KPI because I've seen so many dashboards just die when it becomes a hassle to maintain. Oh, and definitely test your template with a small group first. You'll catch the obvious problems before rolling it out to everyone. Trust me, realistic targets are way better than aspirational ones that make people give up.
Honestly, KPI templates are game-changers for accountability because everything becomes super transparent. When people know exactly what they're responsible for and can see how everyone else is doing, they step up way more. It's basically like a public scoreboard - nobody wants to be the person constantly falling short, you know? Plus it kills that annoying "not my problem" attitude since roles are spelled out clearly. Here's what actually works though: let your team set their own targets within the template. People buy in so much more when they've chosen their own numbers instead of having goals shoved at them.
So for your dashboard, definitely track MQLs and conversion rates first - that's your bread and butter. Customer acquisition cost matters too, plus lifetime value for the full ROI picture. Traffic sources and email metrics show which channels actually work. Pipeline velocity is honestly underrated but super telling about how smooth your sales handoff is. Oh, and revenue attribution - you need that to prove campaigns are worth the budget. Start with maybe 6-8 metrics max though. I made the mistake of cramming everything in once and it was just noise. Focus on what actually moves your quarterly numbers.
So basically, leading indicators show what's coming while lagging ones tell you what already went down. I like to think of it as leading = stuff you control, lagging = results you got. For your template, maybe try like 60% leading and 40% lagging? Leading could be pipeline activity or training hours. Lagging is your revenue, customer satisfaction, that kind of thing. Oh and I always color-code them differently - makes it way easier to spot the difference when you're scanning through data. Start with your main lagging metrics first, then figure out what leading stuff actually drives those numbers.
Honestly, start with your data sources - make sure they're actually reliable because bad data will mess up everything downstream. Get someone to own each KPI so there's actual accountability (nobody likes when metrics are everyone's responsibility but nobody's fault). Set up some automated alerts for weird spikes or gaps. Monthly check-ins work well to make sure you're still tracking stuff that matters. Oh, and document what you've got now first - sounds boring but you'll thank yourself later when you're trying to figure out where that random number came from.
Honestly, I'd check them monthly but do deeper reviews quarterly. Monthly helps you spot weird trends before they become problems. Companies mess this up all the time - they'll set KPIs in January then completely ignore them until the next year. Terrible idea! Your business shifts constantly, and metrics that seemed crucial in winter might be totally useless by summer. Quarterly is when you should really dig in and ask if you're even tracking the right stuff. Oh, and actually put these review dates in your calendar right now or you'll keep making excuses to skip them.
Don't try tracking everything - that's where most people mess up. Pick maybe 3-5 metrics per project phase and just bake them into whatever tools you're already using. Manual tracking? Total waste of time, nobody keeps up with it. Get your dashboards pulling data automatically and assign someone to actually own each metric. Weekly quick check-ins work way better than those marathon status meetings. Oh, and start small - grab one important metric for your next sprint and see how it goes. The whole thing should feel natural, not like you're doing homework on top of your real work.
The key is switching out those core metrics for ones that actually matter in your industry. Healthcare? You're looking at patient outcomes, readmission rates, satisfaction scores - not some random revenue targets. Finance is completely different - risk ratios, compliance rates, portfolio stuff. Your template structure can stay the same though, which honestly saves you a ton of work. Keep your charts and tracking setup, just swap the KPI categories and benchmarks. I'd start by figuring out what metrics your sector obsesses over - there's usually like 5-6 "must-track" ones everyone talks about. Then just plug those into what you've already built.
Okay so for your KPI report, start with the big stuff first - your most critical metrics right at the top. Include current numbers, what you're targeting, and timeframe (monthly/quarterly/whatever makes sense). Charts are clutch because honestly, walls of numbers just make people's eyes glaze over. The real key though? Don't just dump data - explain what it actually means and why people should care. Show trends so everyone knows if you're headed up or down. Oh, and if there's weird external stuff messing with your numbers (like that supply chain nightmare last quarter), call it out. Makes you look way more credible.
Dude, tell stories with your data instead of just dumping numbers on people. Charts work way better than spreadsheets - nobody wants to stare at raw figures. Start with why they should care first. Like, that 15% bump in customer satisfaction? Show them how it actually affects the bottom line. Traffic light dashboards are honestly a lifesaver - red, yellow, green and boom, everyone gets it instantly. Oh and skip all the technical jargon completely. Connect everything back to stuff they're already obsessing over, whether that's revenue targets or customer happiness scores. Makes such a difference when people can see themselves in the data.
Honestly, ditch the Excel nightmare and grab a proper dashboard tool. Tableau's solid but pricey, Power BI works great if you're in the Microsoft world, or Google Data Studio won't cost you anything. Monday.com and Asana are decent for tracking progress too - I actually prefer Asana's interface, feels cleaner. Oh, and if you're already stuck with Salesforce or HubSpot, they've got KPI stuff built right in. Figure out your top 3-4 metrics first though. Then pick one tool and actually train everyone on it properly, otherwise people just ignore it.
Honestly, benchmarking is a game changer - it stops you from setting random targets that make no sense. I used to think our conversion rates sucked until I checked what everyone else was hitting! You'll actually know if you're killing it or need work when you compare against industry standards. Your team gets realistic goals instead of impossible ones. Stakeholders eat this stuff up too because they love seeing competitor comparisons. Oh, and it saves you from that awkward "why did we pick 25% growth?" question in meetings. Just grab 3-5 solid benchmarks for your main KPIs and tweak your targets from there.
-
Wonderful templates design to use in business meetings.
-
Perfect template with attractive color combination.