


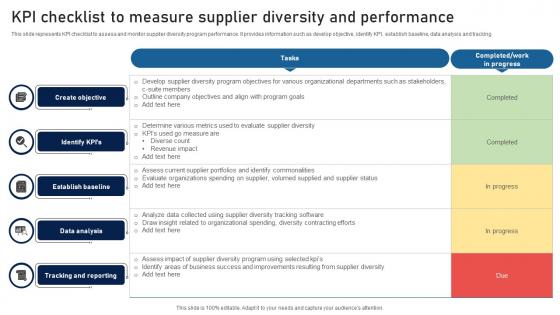
KPI Checklist To Measure Supplier Diversity And Performance




Try Before you Buy Download Free Sample Product
 Impress Your
 Audience
 100%
100% Editable
 Save Hours
 of Time


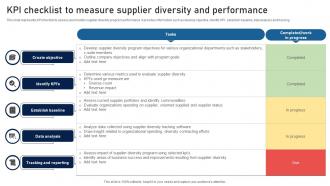
This slide represents KPI checklist to assess and monitor supplier diversity program performance. It provides information such as develop objective, identify KPI, establish baseline, data analysis and tracking.
People who downloaded this PowerPoint presentation also viewed the following :
KPI Checklist To Measure Supplier Diversity And Performance with all 6 slides:
Use our KPI Checklist To Measure Supplier Diversity And Performance to effectively help you save your valuable time. They are readymade to fit into any presentation structure.





FAQs for KPI Checklist To Measure Supplier
Honestly, most companies track way too much stuff that doesn't matter. Start with the money basics - revenue growth, profit margins, and cash flow. Then add customer acquisition cost and lifetime value (those two should always be paired). Conversion rates and employee turnover are solid operational ones. I'd say pick maybe 5-7 that actually connect to what you're trying to achieve. Review them monthly, not daily - you'll drive yourself crazy otherwise. Oh and skip the vanity metrics that just make you feel good but don't change anything. Focus on what you can actually influence through your decisions.
Check out what your competitors are tracking first - their annual reports usually spill the beans on key metrics. Trade associations publish industry benchmarks too, which helps. Don't get crazy with it though. Pick maybe 3-5 metrics that actually connect to your goals and what customers care about. You can tweak things later once you see what matters. I'd avoid the vanity metrics that look impressive but don't really tell you much. Focus on stuff your team can actually impact and that people will want to check every month. Makes meetings way more productive when everyone's looking at numbers that actually mean something.
Think of KPIs as your team's translator - they show how daily work connects to what the company actually wants. Without them, people just wonder if their stuff even matters. Like when someone boosts email open rates by 15%, they should be able to trace that straight to hitting revenue goals. That connection is everything. Your team needs to see their KPIs tie directly to business objectives, otherwise you're all just busy for no reason. It's honestly wild how many teams skip this step. Make sure every team KPI links to at least one company goal.
Check your KPI list every quarter minimum. Fast-moving industry? Monthly makes way more sense. I've watched teams waste time tracking random metrics just because they always have - don't be those people. Your KPIs need to match what you're actually trying to accomplish right now. Set a calendar reminder or you'll forget (guilty as charged). Before each review, ask yourself this: if we crushed every single KPI on here, would we really be winning? That question cuts through so much BS. Sometimes you'll realize half your metrics are just... pointless.
Honestly? Most people go overboard with KPIs and end up drowning in numbers. Pick 3-5 max that actually matter. Don't chase vanity metrics just because they look good - I've seen way too many dashboards that are basically expensive screensavers. Focus on stuff your team can actually control and change. Mix in some early warning indicators with your regular metrics so you're not always reacting after the fact. Each KPI should connect to a real business goal, and when you review them, always ask yourself "okay, so what does this mean?" Otherwise you're just staring at pretty charts that don't help anyone make better decisions.
So basically, leading KPIs show you what's coming down the pipeline - stuff like website visits or how many calls your sales team made this week. Lagging ones tell you what already went down, like actual revenue or those customer satisfaction surveys. The thing is, you can't steer a ship by staring at its wake, you know? If you're only watching the lagging stuff, you're constantly playing catch-up after problems already hit. Leading indicators actually let you see trouble coming and pivot before you're screwed. I'd say track at least one leading metric for every lagging one you've got going.
Honestly, templates are a game changer for showing KPI data. Raw spreadsheets just make people's brains shut off - I've seen it happen in so many meetings. Dashboards and charts tell the actual story behind your numbers instead of burying insights in rows of data. Plus you won't waste time reformatting everything from scratch each month. Pick maybe 2-3 solid template styles for your regular reports and just roll with those. Way better than reinventing how you present stuff every single time. Your stakeholders will actually pay attention instead of zoning out.
Honestly? Start simple with whatever your team already uses - Excel or Google Sheets work great for basic tracking. Power BI and Tableau are amazing if you need fancy visuals, but they're overkill at first. Most CRMs like Salesforce or HubSpot have KPI stuff built right in too, which is pretty convenient. I'd probably just pick your most important 3-4 metrics first instead of going crazy with everything. You can always get fancier later once you figure out what actually matters for your business. Oh, and Monday.com's dashboard features are surprisingly solid if you're already using it for project stuff.
Honestly, if you're at a startup, just track 3-5 things that'll keep you alive - cash runway, customer acquisition costs, maybe some product-market fit stuff. That's it. Don't overcomplicate when you're barely keeping the lights on. Bigger companies? They can get fancy with departmental breakdowns and all that. More resources = more tracking capability, I guess. Though even they shouldn't go crazy with their main dashboard. Really depends where you're at right now. Early stage means survival mode. Pick what actually matters for your specific mess and ignore the rest for now.
Look at what you've done before - that's your starting point. Any big changes coming? New team members, different market conditions, extra budget? Factor those in. Personally, I think 10-15% above current performance is the sweet spot. Pushes you without being totally unrealistic. Don't just decide this stuff alone though - get your team involved since they're doing the actual work. Makes a huge difference when people help set their own targets instead of having them imposed from above. Trust me, saves so much headache later when goals actually feel achievable.
Look, if your team doesn't give a damn, your KPI data is basically worthless. Disengaged people will either half-ass the data entry or straight-up game the numbers to look good on paper. Been there, seen that mess firsthand. But when people actually care? They'll use those metrics to get better instead of just checking boxes. The whole thing becomes a tool for them, not some Big Brother nonsense. So yeah, before you launch that shiny new dashboard, take time to explain why these numbers actually matter for their day-to-day work. Otherwise you're just collecting expensive garbage.
Start with your biggest metrics - that's what everyone actually cares about. Skip the massive spreadsheets and use simple charts instead. People's attention spans are terrible these days, so don't overwhelm them with every single number you've got. Context is huge though - tell them if a trend is good or bad and why it's happening. Executives just want the big picture while managers need the nitty-gritty details. Here's the thing: always end with what you're gonna do about it. Otherwise you're just showing off data without any real purpose, which honestly drives me crazy.
Yeah, totally doable! Rating scales work great - like 1-5 for customer satisfaction or setting goals around "90% positive feedback." Surveys are honestly your easiest bet for turning fuzzy feelings into actual numbers you can track. You could also count stuff like complaints per month or track employee engagement scores. The trick is deciding what "success" looks like before you start measuring - otherwise you're just collecting random data that makes everyone feel warm and fuzzy. Oh, and don't forget to assign someone to actually own these metrics and review them regularly, just like your other KPIs.
Honestly, you really need those industry benchmarks or you're just guessing if you're doing well. Picture this - you hit 15% conversion and think you're killing it, then find out everyone else is at 25%. Ouch. These benchmarks help you figure out realistic goals and show your boss exactly why you need more budget. "Hey, we're 20% behind the competition" hits different than just asking for stuff, you know? Check your industry associations first - they usually have the best data. Some reports are pricey but totally worth it.
Honestly, stop treating KPIs like a report card for stuff that already happened. Make them about what's coming next instead. Monthly check-ins work way better than quarterly ones - by then you're basically screwed if something's off track. Your targets should push people but not be totally unrealistic, and everyone needs to actually understand how their numbers connect to the bigger picture. Nothing's worse than feeling like your work is pointless. Oh, and celebrate the small wins! When teams miss targets, treat it like a learning thing, not a finger-pointing disaster. That's when the real progress happens.
-
Like always a great experience with you guys. Always there on the drop of hat to help.
-
The service is fast, and I could access any presentation after buying the subscription. I don’t think I’ll ever have to worry about a presentation in my life.