


Supplier Development Program Kpi Dashboard For Supplier Monitoring




Try Before you Buy Download Free Sample Product
 Impress Your
 Audience
 100%
100% Editable
 Save Hours
 of Time


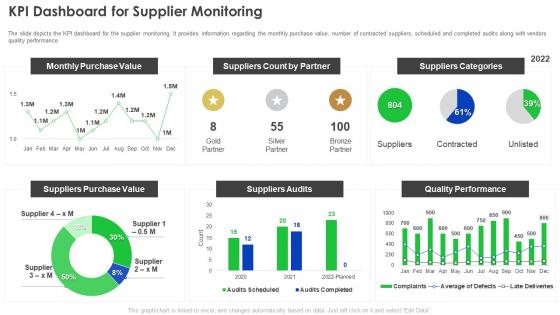
The slide depicts the KPI dashboard for the supplier monitoring. It provides information regarding the monthly purchase value, number of contracted suppliers, scheduled and completed audits along with vendors quality performance.
People who downloaded this PowerPoint presentation also viewed the following :
Supplier Development Program Kpi Dashboard For Supplier Monitoring with all 7 slides:
Use our Supplier Development Program Kpi Dashboard For Supplier Monitoring to effectively help you save your valuable time. They are readymade to fit into any presentation structure.





FAQs for Supplier Development Program Kpi Dashboard
Key supplier development KPIs include quality metrics, delivery performance, cost reduction, innovation contribution, sustainability compliance, and relationship strength scores. These indicators enable organizations to streamline vendor management by tracking defect rates, on-time deliveries, and collaborative improvements, with many procurement teams finding that comprehensive KPI dashboards ultimately deliver enhanced supplier partnerships and competitive operational advantages.
A KPI dashboard enhances supplier performance visibility by consolidating real-time metrics like delivery rates, quality scores, compliance levels, and cost variances into unified views. Through automated tracking and visual analytics, procurement teams can quickly identify underperforming vendors, monitor contract adherence, and benchmark supplier relationships, ultimately enabling proactive management decisions and stronger supply chain partnerships.
**INPUT**: What data sources should be integrated into a supplier development KPI dashboard? **OUTPUT**: Supplier development KPI dashboards should integrate procurement systems, quality management databases, financial performance records, delivery tracking platforms, and supplier self-assessment portals. These comprehensive data sources enable organizations to monitor supplier performance, identify improvement opportunities, and strengthen partnerships, with many companies finding that integrated dashboards streamline vendor relationships while delivering enhanced operational efficiency. *Word count: 54 words*
Supplier KPIs should be reviewed monthly for operational metrics like delivery and quality, with quarterly assessments for strategic performance indicators and annual comprehensive evaluations of contract terms and benchmarks. This tiered approach enables organizations to address immediate issues quickly while maintaining long-term supplier relationships, ultimately delivering improved supply chain reliability and competitive advantage.
Qualitative data in supplier KPI dashboards provides crucial context beyond numerical metrics, including supplier relationship quality, communication effectiveness, innovation capabilities, and compliance culture assessments. This contextual information enables procurement teams to make more informed strategic decisions by combining quantitative performance scores with qualitative insights, ultimately delivering deeper supplier partnerships and enhanced risk management across complex supply chains.
Organizations ensure alignment between supplier KPIs and overall business objectives by establishing clear performance metrics tied to strategic goals, conducting regular alignment reviews, and implementing cascading scorecards that connect supplier performance to corporate outcomes. This strategic approach enables companies to monitor cost reduction, quality improvements, and delivery performance while maintaining transparency, with many procurement teams finding that aligned KPIs ultimately deliver enhanced supplier relationships and competitive advantage.
Common challenges include inconsistent data formats across suppliers, limited supplier technology capabilities, manual data collection processes, lack of standardized metrics, and poor data quality or completeness. These obstacles can significantly impact dashboard accuracy and real-time visibility, with many organizations finding that establishing clear data governance frameworks and supplier onboarding protocols ultimately streamlines collection while enhancing supplier relationships and operational transparency.
Organizations effectively benchmark supplier performance by establishing standardized metrics across quality scores, delivery timeliness, cost efficiency, compliance rates, and innovation contributions. Through comprehensive KPI dashboards, companies can compare suppliers against industry standards, peer performance, and historical data, while identifying top performers and improvement opportunities, ultimately enabling strategic sourcing decisions and stronger supplier relationships.
**INPUT**: What tools or software are recommended for creating a supplier development KPI dashboard? **OUTPUT**: Recommended tools include Power BI, Tableau, Excel with Power Query, SAP Analytics Cloud, and Qlik Sense for comprehensive supplier performance tracking. These platforms streamline data integration, automate reporting workflows, and enhance vendor relationship management through real-time analytics, with many procurement teams finding that centralized dashboards significantly improve supplier collaboration and strategic sourcing decisions. **Word count: 54 words**
Visualizations in supplier development KPI dashboards improve stakeholder communication by transforming complex performance data into clear charts, graphs, and trend indicators that everyone can quickly understand and interpret. These visual elements enable procurement teams, suppliers, and executives to identify performance gaps, track improvement progress, and align on strategic priorities more effectively, ultimately delivering faster decision-making and stronger supplier relationships.
Key industry standards include ISO 9001 for quality management, ISO 14001 for environmental compliance, OHSAS 18001 for safety protocols, and sector-specific frameworks like automotive IATF 16949 or pharmaceutical GMP requirements. These standards enable organizations to establish consistent measurement criteria, ensure regulatory compliance, and benchmark supplier performance against recognized best practices, ultimately delivering improved quality control, reduced operational risks, and enhanced competitive positioning across global supply chains.
Companies track supplier risk and compliance through KPIs including compliance audit scores, risk assessment ratings, certification status, incident response times, and regulatory adherence percentages. These metrics enable procurement teams to monitor supplier performance proactively, identify potential disruptions early, and maintain supply chain resilience, with many organizations finding that integrated dashboards streamline vendor management while reducing operational risks.
Supplier innovation significantly enhances KPI evaluations by improving quality metrics, reducing costs, accelerating delivery times, and increasing overall supplier performance scores. Organizations tracking innovation KPIs find that suppliers introducing new technologies, processes, or materials consistently outperform traditional metrics, with many companies in manufacturing and technology sectors experiencing reduced defect rates and enhanced competitive advantage through strategic supplier partnerships.
Feedback loops can be established through automated performance alerts, regular supplier scorecards, collaborative improvement sessions, and structured communication channels that enable real-time dialogue. These mechanisms streamline performance monitoring by identifying gaps quickly, facilitating targeted interventions, and fostering partnership-based relationships, with many organizations finding that continuous feedback cycles ultimately deliver enhanced supplier reliability and competitive advantage.
Best practices for presenting supplier KPIs in dashboards include using visual hierarchies with critical metrics prominently displayed, implementing color-coded performance indicators, grouping related metrics by categories like quality and delivery, and ensuring real-time data updates. These approaches streamline supplier management by enabling quick performance assessment, facilitating faster decision-making, and enhancing transparency, with procurement teams finding that well-structured dashboards ultimately deliver improved supplier relationships and operational efficiency.
-
SlideTeam is a great place for PPT templates. They have many templates on a single topic. It has made my life a lot easier.
-
Good research work and creative work done on every template.