

Quality Monitoring KPI Dashboard For Construction Industry





Try Before you Buy Download Free Sample Product
 Impress Your
Audience
 100%
Editable
 Save Hours
of Time


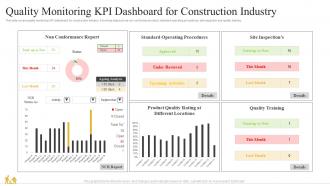
This slide covers quality monitoring KPI dashboard for construction industry. It involves data such as non conformance report, standard operating procedures, site inspection and quality training.
People who downloaded this PowerPoint presentation also viewed the following :
Quality Monitoring KPI Dashboard For Construction Industry with all 7 slides:
Use our Quality Monitoring KPI Dashboard For Construction Industry to effectively help you save your valuable time. They are readymade to fit into any presentation structure.





FAQs for Quality Monitoring KPI Dashboard
Definitely focus on defect rates and customer satisfaction scores first - those are your bread and butter. First-pass yield and resolution times matter too. Cost of quality tracking can save you tons of headaches down the road, trust me on that one. Supplier performance metrics are solid if you're working with vendors. Trend analysis is clutch for spotting patterns over time. If you're in manufacturing, throw in some process capability stuff. But honestly? Don't get caught up making dashboards that just look fancy. Pick metrics that'll actually help your team make real decisions, not ones that impress executives in quarterly reviews.
So basically you get real-time visibility into your quality metrics instead of waiting around for monthly reports or angry customers. Game changer honestly. You'll spot trends as they develop and catch issues early. Think of it like a health monitor for your processes - once you start checking it regularly, you won't know how you lived without it. Quick identification of problem areas, tracking improvements, making actual data-driven decisions instead of just winging it. The trick is picking the right metrics upfront and then actually acting on what you see, not just admiring pretty charts.
Look, you absolutely need real-time data for your quality dashboard. When metrics update live, you can actually fix problems as they're happening instead of finding out about them tomorrow. It's honestly like the difference between a smoke detector and discovering the fire the next day. Yesterday's numbers won't help you when quality scores are tanking right now. Without live feeds, you're basically driving by looking in the rearview mirror – not ideal, obviously. Set up alerts for your key thresholds so you get pinged the second something goes wrong.
So most dashboards have this custom view thing where you can filter by department. First step is figuring out what metrics actually matter to each team - like sales cares about defect rates per product, manufacturing wants yield percentages and rework costs. Pretty straightforward once you poke around the settings. You can drag widgets around, set up alerts when numbers hit certain thresholds, switch between charts and tables. Honestly the drag-and-drop stuff is way easier than I expected. I'd definitely sit down with each department head first though - get their top 3-5 must-have metrics mapped out before you start building anything.
Tableau and Power BI are probably your best bets - they handle complex quality stuff really well and plug into basically everything. Grafana's great if you need real-time monitoring. Honestly though, I've watched teams overthink this and spend months on fancy dashboards when simple Excel would've worked fine. Qlik Sense is solid too for heavy data digging. Really depends on how complex your data is and whether your team's technical or not. Oh, check if you already have Power BI through Office 365 first - might save you some budget headaches.
Check your KPIs monthly at the bare minimum. Weekly's even better if quality stuff is mission-critical for you. Don't go crazy chasing every tiny blip though - that'll drive you nuts. But you can't sleep on major trends either, you know? I do quarterly deep dives where we totally rethink what we're measuring. Sometimes you realize you've been tracking useless metrics for months. Your dashboard should change as your business grows anyway. Start monthly and see how jumpy your numbers are. If they're all over the place, maybe bump it to weekly.
Don't cram everything onto one screen - that's the fastest way to confuse everyone. Skip the vanity metrics too, like showing total call volume without any context (looks fancy but tells you nothing useful). Those red/yellow/green traffic lights are so overdone at this point. Daily updates create way too much noise - resist that urge. Each metric should actually answer "so what?" when someone looks at it. Honestly, I'd start with maybe 5-7 KPIs that directly impact your quality outcomes. You can always add more later based on what people actually find helpful.
Honestly, charts and graphs are a game changer for quality data. You know how you stare at spreadsheets wondering if 2.3% defects is good or awful? Visual dashboards make that stuff crystal clear instantly. Heat maps show you exactly which product lines are tanking, while trend lines prove whether your fixes actually work over time. I swear it's night and day compared to boring static reports. Color coding helps critical thresholds jump out so you catch problems early. Just start simple - maybe your top 3-5 metrics displayed visually. Way better than drowning in numbers.
So basically you need to turn those fuzzy insights into actual numbers. Try scoring customer feedback on like a 1-5 scale, or use text analysis tools to spot patterns in comments - sentiment analysis is surprisingly decent for this. Just make sure everyone on your team scores stuff the same way or you'll get wonky data. Oh, and add little notes to your charts explaining weird dips, like "satisfaction tanked here because the system crashed for 3 days." Honestly though, start small with just 2-3 qualitative things. Otherwise your dashboard becomes this overwhelming mess nobody wants to look at.
So you'll want to dig into those underperforming metrics first - see if there's a pattern with certain teams or time periods. The visuals really help here because honestly, staring at spreadsheets all day makes me want to cry. Set up regular check-ins with your team to actually talk through what you're seeing. Track whether your fixes are working or if you're just spinning your wheels. Oh, and don't be like my old manager who only looked at dashboards during quarterly reviews - make it part of your weekly routine. The trends become way more obvious when you're checking consistently.
Manufacturing companies watch defect rates and production quality in real-time. Healthcare obviously focuses on patient safety and treatment outcomes. Call centers track first-call resolution plus customer satisfaction - makes sense since those directly connect. Software teams do really well with bug detection and deployment success rates. Financial services can't mess around, so they monitor transaction accuracy and compliance constantly. Retail looks at returns and customer feedback mostly. Honestly, the trick isn't tracking everything - pick maybe 4-6 metrics that actually matter to your customers. Update them often enough that people make real decisions, not just stare at pretty dashboards.
Build feedback loops from the start - seriously, this saves so much headache later. Talk to your actual users first to figure out which KPIs they care about and how they like seeing data. Weekly check-ins during development work great, let them play with prototypes and tell you what sucks. Once it's live, throw a feedback widget right in there. Makes it super easy for people to complain (they will anyway). The trick is actually listening to what they say and fixing stuff. I learned this the hard way after building a beautiful dashboard that nobody touched for months.
You'll want to hit three main things with your team. Start with the KPIs themselves - what each metric actually means and why it matters for quality stuff. Then cover the technical side: navigating the interface, filtering data, generating reports. People always get hung up on the buttons and menus at first. Most important though? Teaching them to read the data and turn it into real improvements. Honestly, skip the boring documentation route. Do hands-on workshops instead - way more effective when people can just mess around with it themselves.
So basically, benchmarking stops your KPI dashboard from being useless numbers floating around. Like, is 95% customer satisfaction actually good? Who knows without comparing it to your industry average, right? Your dashboard starts highlighting real problems and wins instead of just looking pretty. Stakeholders eat this stuff up too - they love seeing how you beat the competition (honestly makes those boring meetings way more engaging). The tricky part is finding solid benchmark sources and keeping them fresh. Otherwise you're just comparing yourself to outdated data, which defeats the whole point.
Three things will save your sanity here: data validation, source control, and regular audits. Build automated checks that catch outliers and missing data before it hits your dashboard - saves you so much cleanup later. Pull from centralized, reliable sources instead of letting everyone submit their own numbers (learned this the hard way). Monthly reviews are clutch for spot-checking calculations and making sure your metrics actually match what's happening in the business. Oh, and build these checks into your workflow from the start. Trying to fix garbage data after it's already live? Not fun.
-
I am extremely pleased with these PPT slides that we used for our event. They were easy to modify and came out great in all aspects!
-
Content of slide is easy to understand and edit.