Procurement Spend Analysis KPI Dashboard

Rating:
90%
Procurement Spend Analysis KPI Dashboard Procurement Spend Analysis KPI Dashboard
Slide 1 of 7

or

Favourites Favourites

Try Before you Buy Download Free Sample Product

Audience Impress Your
Audience
Editable 100%
Editable
Time Save Hours
of Time
The Biggest Sale is ending soon in
0
0
:
0
0
:
0
0
Rating:
90%
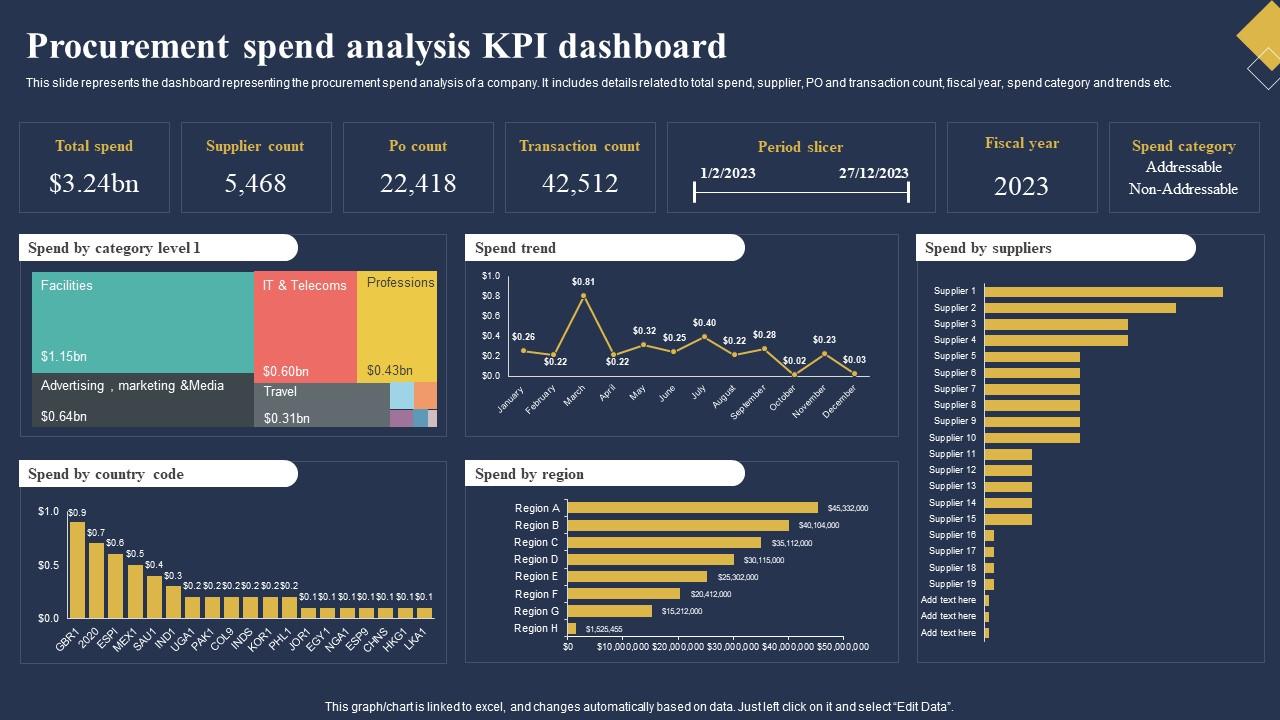
This slide represents the dashboard representing the procurement spend analysis of a company. It includes details related to total spend, supplier, PO and transaction count, fiscal year, spend category and trends etc. Introducing our Procurement Spend Analysis KPI Dashboard set of slides. The topics discussed in these slides are Transaction Count, Period Slicer, Spend Category. This is an immediately available PowerPoint presentation that can be conveniently customized. Download it and convince your audience.

People who downloaded this PowerPoint presentation also viewed the following :

FAQs for Procurement Spend

You need clean data classification first - that's your foundation. Then look at supplier consolidation and how spending breaks down by department. Pricing trends over time are huge too. Honestly, maverick spending is probably your biggest headache - people buying from random vendors instead of your approved list. Happens constantly. Contract compliance analysis will show you if anyone's actually using those rates you negotiated (spoiler: they're probably not). Focus on categories that make up your top 80% of spend first. The small stuff can wait.

Dude, spend analysis is a game changer for profits. Pull your top 20 suppliers first - that's where most of the money is hiding anyway. You'll find duplicate vendors you didn't even know about, plus all that rogue spending happening without approval. Once you see the full picture, you can bundle purchases to negotiate way better deals. The data shows cost trends early too, so you're not scrambling when prices spike. Most companies save like 5-15% on procurement just from having visibility. Honestly, it's kind of crazy how much waste you don't realize is there until you actually look at the numbers.

Honestly, if you've got the budget, go straight for Coupa, Ariba, or Ivalua - they're made for this stuff and will save you tons of headaches. Excel can work too if money's tight, but you'll be doing way more manual data cleanup (been there, not fun). Power BI's pretty decent, and Tableau sits somewhere in between. Oh, and whatever you pick needs to play nice with your ERP system - that's non-negotiable. I'd actually start by figuring out where all your data lives first, then pick the tool that connects easiest. Makes the whole process way smoother.

First thing - dump all your spending data into one spot and sort it by supplier or department. Your ERP system should spit out reports for this, but honestly the data's always a hot mess. Sort everything by dollar amounts to find your biggest spending buckets. Don't forget indirect stuff like office supplies and travel, not just your main materials and services. Here's the thing - you'll probably see that classic 80/20 split where most of your money goes to just a handful of categories. Start there since that's obviously where you'll make the biggest dent.

Honestly, data viz just makes those nightmare spreadsheets actually readable. Bar charts showing spend by category are your best friend - way better than squinting at endless rows of numbers. Heat maps will show you which suppliers are all over the place with pricing (some are wild, trust me). Charts help you catch patterns super fast, like where you're hemorrhaging cash. Plus when you need to present to higher-ups, they'll actually pay attention to a clean dashboard instead of glazing over at raw data. Start simple, then get fancier once you're comfortable.

Honestly, quarterly works for most companies, but monthly is way better if you can swing it. Think of it like your bank account - you don't want to be blindsided by weird spending patterns. Annual reviews? Too slow. Markets shift, suppliers jack up prices, and you'll miss opportunities sitting there. High volume or crazy volatile markets mean you should definitely go monthly. I'd start with quarterly deep dives on your biggest spend categories - like the top 80% - then add monthly quick checks on the major stuff. Oh, and actually put it in your calendar right now or you'll never do it. Consistency beats perfection every time.

Ugh, data quality issues will drive you insane. Your spend info is probably everywhere - procurement systems, ERP, plus Karen's ancient spreadsheets that she refuses to give up. Supplier names are inconsistent, you'll have duplicate entries, and half the transaction records are missing something important. Classification is the worst part though. Everyone's using different coding systems so nothing matches up. Honestly? Clean up your data sources first - don't even think about analysis yet. Get naming conventions sorted and fix your approval workflows. Trust me on this one.

Start with basic data governance - create clear rules for entering and categorizing spend data. Clean your data regularly because bad data in means useless reports out. Automated checks help catch outliers and missing info. Standardize supplier names and category codes so everything aligns properly. Someone needs to actually own this mess though - assign data stewards for quality control. Monthly audits catch problems before they snowball. Cross-reference spend data with invoices and contracts to verify it's accurate. Trust me, this upfront work saves tons of headaches later when you're actually trying to make decisions from the data.

Honestly, just start with lifecycle costing - that's your bread and butter. Add up purchase price, operating costs, maintenance, training, disposal costs over the whole lifespan. Activity-based costing is another solid route where you track every activity tied to using that thing. Some folks go nuts with discounted cash flow models but that's way too much for most decisions IMO. The real trick? Stay consistent with what you're including when you compare suppliers. I'd map out all your cost buckets first, then build from there. Simple beats complicated every time.

Look, spend analysis is basically your secret weapon for supplier negotiations. You can walk into meetings with hard data - exact volumes, who your real partners are versus random vendors. Game changer. Short story: those insights help you figure out which relationships actually matter. That supplier you hit up twice a year? Probably not worth the wine-and-dine treatment. Focus on your top performers instead. Once you've got the data, tier your suppliers and put your energy where it'll actually impact costs and service. Makes those conversations so much more productive when you're not flying blind.

Start with spend visibility - you can't fix what you don't see, honestly. Track your spend by category, supplier concentration risk, and maverick spending (basically off-contract purchases that bypass your deals). Cost savings is obvious but don't forget supplier performance stuff like delivery times and quality scores. Most people skip those but they matter way more than you'd think. Contract compliance rate is huge since it directly hits your negotiated savings. Oh, and build monthly dashboards for this stuff - reviewing with stakeholders keeps everyone honest about actually hitting targets.

So spend analysis shows you where all your money's going, right? Category management is what you actually DO with that info. You group similar purchases together and figure out how to buy them smarter. Like, your analysis might reveal you're buying office supplies from 12 different vendors (why though?). Then category management kicks in - you'd consolidate those suppliers, negotiate better deals, maybe standardize what people can order. I'd honestly just start with whatever categories eat up the most cash. Those give you the biggest bang for your buck when you optimize them.

Honestly, spend analysis is perfect for this. Track where your money goes and you'll spot which suppliers aren't hitting sustainability standards. Plus you can consolidate vendors - less shipping, better for the planet. Short sentences work too. The data shows you exactly where your supply chain's carbon footprint is worst, so you know which supplier relationships need work first. I'd start by adding sustainability metrics to your spend categories (might take a bit of setup time but worth it). Then you can actually make smart decisions about pushing for greener alternatives instead of just guessing.

Think of spend analysis as your radar for spotting trouble before it hits. You'll catch vendors breaking compliance rules and find those scary single-supplier situations that could wreck everything. Monthly reports on your biggest spend categories - like the top 80% - show you where you're too dependent on one supplier. It also reveals when people are going rogue and buying stuff outside your normal process. Honestly, most teams only look at this data when something's already gone wrong, which is backwards. You can track diversity goals too, plus see if spending actually matches what's in your contracts. Way better to be proactive about it.

Honestly, benchmarking is a game-changer because it shows you what you should actually be paying. Compare your contracts and supplier performance against industry standards - you'll quickly spot where you're getting ripped off. It's basically a sanity check for your procurement choices, which is clutch when your boss questions the budget or you're negotiating deals. Finding good benchmark data can be tricky though. Industry reports work, or try procurement networks and third-party databases. Focus on your biggest spend categories first - that's where the real money is.

Ratings and Reviews

90% of 100
Review Form
Write a review
Most Relevant Reviews
  1. 100%

    by Coy Wallace

    The customer care of SlideTeam is very responsive. I was having a payment issue and they fixed it for me in no time.
  2. 80%

    by Demarcus Robertson

    Huge collection of high-quality templates. Worth each penny. 

2 Item(s)

per page: