


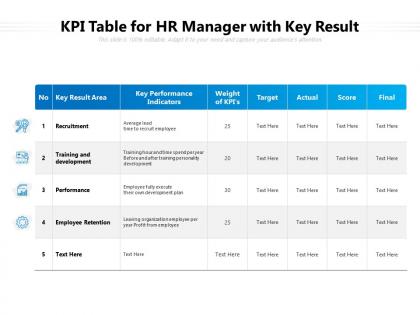
Kennzahlen-Tabelle für HR-Manager mit Schlüsselergebnissen




Try Before you Buy Download Free Sample Product
 Impress Your
 Audience
 100%
100% Editable
 Save Hours
 of Time


Messen Sie den Erfolg der Personalabteilung mithilfe der KPI-Tabelle für HR-Manager mit der Präsentation "Key Result". Beschreiben Sie die Grundformel zur Berechnung von Leistungskennzahlen mithilfe des KPI-Matrix-PPT-Designs. Diese HR-Leistungskennzahlenmatrix-PPT-Vorlage hilft beim Verfolgen der vordefinierten organisatorischen Ziele des Personalmanagements. Nutzen Sie die Projektportfolio-PPT-Infografiken, um Ihre strategischen Ziele zu erreichen, indem Sie den Bericht präsentieren, der eine detaillierte Auflistung der Projekte mit ihrem Status, ihrer Ausrichtung, ihrem Risiko, ihren Budgetkosten, geplanten Kosten und Abweichungen enthält. Sie können leicht darstellen, wie gut das Unternehmen in der Lage ist, Geschäftsziele mithilfe von KPIs in der HR-PowerPoint-Folie zu erreichen. Beschreiben Sie hoch- und niedrigstufe KPIs und zeigen Sie, wie sie sich auf die Gesamtleistung des Unternehmens auswirken. Optimieren Sie Rekrutierungsprozesse, Mitarbeiterbindung, Fluktuationsraten, Schulungskosten usw. mit dieser KPI-Dashboard-PPT-Vorlage. Verfolgen Sie die organisatorischen Ziele der Personalabteilung, indem Sie die Folie für das Portfoliomanagement einfach herunterladen.
People who downloaded this PowerPoint presentation also viewed the following :
Inhalt dieser Powerpoint-Präsentation
Die Personalabteilung ist eine kritische Abteilung in allen Unternehmen, die dazu beiträgt, dass es organisiert bleibt und relevante Gesetze in Bezug auf Einstellung und Vergütung eingehalten werden. Ihre Hauptfunktion ist es jedoch sicherzustellen, dass die Produktivität und Motivation (auch als Engagement bezeichnet) der Mitarbeiter hoch sind und es immer eine positive Korrelation zwischen der Arbeit der Mitarbeiter, ihrer Zufriedenheit damit und dem Unternehmen gibt.
Ein HR-KPI-Dashboard zum Kundenengagement zeigt alles, was im Unternehmen richtig oder falsch läuft.
Ein HR-Manager überwacht alle wichtigen Aufgaben, die sicherstellen, dass die Einstellungs-, Lern- und Schulungsbedürfnisse aller Mitarbeiter optimal erfüllt werden. Ein Team unter dem Manager führt diese Aufgaben aus, aber der Manager ist für die Überwachung und die Gesamtverantwortung zuständig.
Um sicherzustellen, dass es überprüfbare, erreichbare und transparente Mechanismen gibt, die mit jeder dieser Aufgaben verbunden sind, steht in allen Organisationen ein System mit Leistungskennzahlen (Key Performance Indicators, KPIs) zur Verfügung.
Diese Vorlage und das folgende Template gehen tief in die KPI-Tabelle für HR-Manager mit Schlüsselergebnissen ein.
Die Idee ist es, sicherzustellen, dass die KPIs von HR-Managern Anerkennung finden und sie leicht Schritte unternehmen können, um sie bei Bedarf zu korrigieren.
Unternehmen haben oft Schwierigkeiten, eine gut definierte Tabelle zu erstellen, die alle wichtigen Funktionsbereiche mit kritischen KPIs erfasst. Daher hat SlideTeam diese übersichtliche Vorlage und viele andere bereitgestellt, um sicherzustellen, dass Unternehmen KPIs mit minimalem Aufwand implementieren können, indem sie einfach unsere von Experten kuratierten Folien herunterladen.
Jede der Vorlagen ist zu 100% editierbar und anpassbar und bietet Ihnen Struktur, einen Ausgangspunkt und die Möglichkeit, sie an das Zielpublikum anzupassen.
Vorlage 1 KPI-Tabelle für HR-Manager mit Schlüsselergebnissen in PowerPoint-Präsentationen
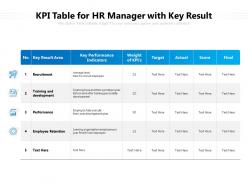
Dies ist eine erstklassige PowerPoint-Vorlage für einen HR-Manager, um seine Leistungskennzahlen (Key Performance Indicators, KPIs) festzulegen und zu bewerten. Die Idee ist es, sicherzustellen, dass jeder der KPIs in ihren Funktionsbereichen Einstellung, Schulung und Entwicklung, Leistung und Mitarbeiterbindung angemessene Gewichtungen zugewiesen werden. Das Ziel und der Ist-Wert werden in die übersichtliche Tabelle eingetragen, die die Folie bietet. Auch der tatsächliche Wert für die Variable wird ausgefüllt, und es ist Platz für abschließende Kommentare vorgesehen. Diese inhaltsfertige PowerPoint-Folie zeigt alle Funktionsbereiche des Personalmanagements, um sicherzustellen, dass die Bewertung der KPIs fair, transparent und gut akzeptiert ist. HR-Manager können diese PowerPoint-Vorlage auch verwenden, um die Aufgaben in einem bestimmten Bereich darzulegen. Zum Beispiel ist die durchschnittliche Vorlaufzeit für die Einstellung von Mitarbeitern eine wichtige KPI für Personaler, die sich mit der Einstellung befassen. Laden Sie diese PPT-Grafik jetzt herunter und verstehen Sie, wie HR-Prozesse auch mit überprüfbaren, transparenten Ergebnissen verknüpft und einen Mehrwert für alle geschaffen werden kann. Die Auswahl der Icons, die jeden der Bereiche repräsentieren, wurde sorgfältig getroffen. Die Folie passt perfekt zu den Bedürfnissen Ihres Unternehmens, die Funktionsweise des Personalwesens zu bewerten. Holen Sie sie sich jetzt!
KPIs für HR-Manager sind sehr wichtig
Ohne angemessene und rechtzeitige Informationen über die KPIs von HR-Managern können Unternehmen blind für bevorstehende Krisen in Bezug auf ihre Mitarbeiter sein. Wenn beispielsweise die Einstellungszeit über Jahre hinweg niedrig bleibt, besteht mit hoher Wahrscheinlichkeit ein akuter Personalmangel zu irgendeinem Zeitpunkt, und so weiter. Laden Sie diese PPT von SlideTeam herunter und stellen Sie sicher, dass Sie in Bezug auf Ihre Personalanforderungen immer einen Schritt voraus sind.
Kennzahlen-Tabelle für HR-Manager mit Schlüsselergebnissen, 2 Folien: Folie 1: - Mitarbeiterzufriedenheit - Mitarbeiterbindung - Personalkosten - Weiterbildungsquote Folie 2: - Führungskräfteentwicklung - Diversity-Index - Fluktuationsrate - Onboarding-Erfolgsquote
Bieten Sie Ihrem Publikum ein erfüllendes Erlebnis. Sie werden unsere KPI-Tabelle für HR-Manager mit Schlüsselergebnissen als erhebend empfinden.
FAQs for Kpi table for hr manager
Honestly, start with employee Net Promoter Score and retention rates - those two will tell you everything you need to know right off the bat. Track which departments are bleeding people and look at internal mobility too. Bad managers are engagement killers, so definitely get those 360 reviews going. I'd also watch training completion rates, how many people actually show up to company events, and absenteeism patterns. Oh, and exit interview feedback is gold if you can spot the trends. Some of this stuff overlaps but retention and eNPS are your main indicators. If those look good, you're probably doing something right.
Track both immediate and long-term stuff to get the whole story. Reaction scores and knowledge tests right after training are your starting point. Then wait a few months and check behavior changes through 360 feedback or manager reviews. The money metrics? Compare performance improvements and retention rates between trained vs untrained employees. Honestly, quarterly dashboards make this way easier than I expected. Yeah, it's a bunch of data but the patterns jump out pretty fast when you see everything together. That's your ROI proof right there.
Turnover rate is basically your company's pulse check - I've seen it catch so many issues early. High numbers? Usually means crappy managers, bad pay, toxic culture, or you're hiring the wrong people to begin with. Low turnover sounds great but weirdly low might mean people feel trapped (which isn't ideal either). You'll want to track it monthly and compare to industry standards. That's really the only way to know if your HR stuff is actually working. Oh, and don't panic over one bad month - look for patterns instead.
KPIs will show you exactly where your hiring process is falling apart. I'd track time-to-hire, cost-per-hire, and which job boards actually bring in decent candidates. Most HR teams just spray money everywhere and cross their fingers - it's wild how common that is. You'll quickly see if people bail after phone screens or if certain roles are impossible to fill. Maybe your hiring managers are being unrealistic? Pick like 3-5 metrics and check them monthly. Way better than guessing what's broken.
Start with representation numbers across departments and levels - that's your baseline. Track where diverse candidates drop out during hiring because that's usually eye-opening. Employee engagement scores by demographic group matter way more than overall numbers tbh. Retention and promotion rates tell you if people actually stick around and advance. Pay equity analysis is non-negotiable. Pulse surveys catch sentiment issues early, and exit interview patterns show what's really going wrong. Pick 3-4 metrics tied to your biggest goals first. Don't try measuring everything at once or you'll drown in data.
So I'd focus on the big ones first - turnover rates, eNPS scores, and those engagement surveys. Monthly or quarterly works fine. Exit interviews are honestly where the real tea is, but most companies just stick them in a folder somewhere which is such a waste. Also track how many people you're promoting internally since that stuff matters way more than people think. Absenteeism rates help too. Don't go crazy with like 15 different metrics right off the bat. Pick maybe 3-4 and throw them on a simple dashboard so you can actually see what's happening. Then when something looks off, you can dig deeper.
Honestly, start with the basics - are people actually completing their reviews? Then check if engagement scores improve and whether employees hit goals post-review. Manager feedback quality matters too (some just go through the motions, you know?). Retention of your best people is huge. Internal promotions tell you if you're developing talent or just doing paperwork. But here's what really matters - survey employees about whether the whole thing actually helps them grow. Most companies skip this part. Track those metrics first and you'll spot the problems fast.
Dude, this is huge - probably the single most important thing with KPIs tbh. You want your HR stuff directly tied to what the business actually cares about. Like if they're gunning for 20% revenue growth, focus on how fast you're hiring talent or keeping your top performers around. Those numbers actually matter to leadership. I learned this the hard way - spent months tracking metrics that looked impressive but nobody upstairs gave a damn about them. Now I always ask myself: "Does hitting this number actually help us win?" That question changes everything. Makes you a real partner instead of just... I dunno, the person who does exit interviews.
Honestly, start with turnover rate - it's the obvious baseline. But here's what really matters: break it down by department and how long people have been there. That's where you'll see the real problems. eNPS is clutch because it shows whether employees would actually tell their friends to work there (brutal honesty right there). Time-to-fill for replacements gets overlooked but it's huge - when turnover's bad, recruiting becomes this expensive nightmare. Exit interview patterns are gold too. Internal promotion rates? Critical. Shows if people think they have a future there or they're just marking time until something better comes along.
Honestly, just start with the basics - output per employee and how long tasks actually take to finish. Revenue per person is solid too. Don't go crazy with like 15 different metrics right off the bat, you'll just confuse yourself. Maybe 3-4 max that actually matter for your business. Oh and definitely track sick days/absences since people not showing up obviously kills productivity. I'd set up some kind of monthly tracker so you can catch problems early. Compare stuff month to month and between teams - that's where you'll see the real patterns.
Start with industry standards for your sector - turnover rates, time-to-hire, employee satisfaction stuff like that. But honestly, your own historical data matters just as much for spotting trends. I've found quarterly comparisons way more helpful than yearly ones since everything moves so fast now. Company size and location make a huge difference too - what works for a startup in Austin won't match a big corp in NYC. Pick maybe 3-4 benchmarks that actually align with your biggest headaches and go from there. Don't overcomplicate it at first.
Honestly, tracking the right metrics beats those awful annual surveys everyone ignores. Look at your employee Net Promoter Score and internal mobility rates - they'll show you what's really happening. Exit interview patterns are gold mines too. Department turnover rates? That's how you spot which managers are tanking morale. I'd set up a monthly dashboard (sounds fancy but it's worth it) so you catch problems before half your team bails. Engagement scores tell you if your culture fixes actually work. Don't obsess over single numbers though - it's all about watching trends develop over time.
KPIs are like dashboard warning lights for compliance stuff - when something's flashing, you know where to look. Track things like training completion rates, incident reports, and turnover in risky positions. Audit findings too, obviously. Honestly, the best part is showing leadership you're actually on top of problems instead of scrambling when things go sideways. Set up automated alerts for the critical metrics so you're not stuck checking endless spreadsheets all day. Way better than playing catch-up after something blows up.
Look, data analytics shows you which KPIs actually move the needle vs. just looking pretty on dashboards. You'll spot correlation patterns between your metrics and real business outcomes - like retention or productivity stuff that matters. Plus it catches weird data glitches early. I've seen turnover rates go crazy because someone fat-fingered the termination codes. Super embarrassing in exec meetings. The cool part? Predictive analytics makes your KPIs forward-looking instead of just telling you what already happened. My advice: don't try to boil the ocean. Pick one or two metrics first and really nail those.
Honestly, the biggest pain points are usually data quality and team pushback. Nobody wants to feel like Big Brother is watching, so people either resist or start gaming the numbers. I've seen teams completely BS their metrics just to look good. Choosing what to track is tricky too - you'll want to measure everything but that just creates a mess. Don't even get me started on pulling data from different systems; it's always inconsistent and annoying. Start with maybe 3-4 KPIs that actually move the needle. Be upfront about why you're doing this and let your team help pick what matters.
No Reviews