

Laboratory kpi for test turn around time total costs test accuracy ppt slide





Try Before you Buy Download Free Sample Product
 Impress Your
Audience
 100%
Editable
 Save Hours
of Time


Elaborate on absorbing the impact of fluctuating changes with our Laboratory Kpi For Test Turn Around Time Total Costs Test Accuracy Ppt Slide. Allow for any instability.
People who downloaded this PowerPoint presentation also viewed the following :
Content of this Powerpoint Presentation
Description:
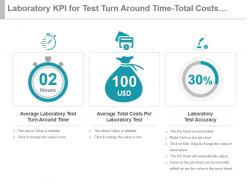
This image showcases a presentation slide that outlines key performance indicators (KPIs) for a laboratory's test processing capabilities. It is designed to inform stakeholders about critical metrics such as test turnaround time, cost efficiency, and accuracy, providing a snapshot of essential information.
The first indicator highlights "02 Hours" as the "Average Laboratory Test Turn-Around Time," indicating the average time taken to complete a test.
The second indicator displays "USD 100" for the "Average Total Costs Per Laboratory Test," representing the average cost incurred for each test.
The third indicator is a pie chart denoting "30% Laboratory Test Accuracy," representing the accuracy rate of the tests being performed.
Use Cases:
Explore the various industries where such a presentation slide could be utilized to effectively communicate laboratory performance metrics:
1. Healthcare:
Use: Display efficiency and performance in medical testing labs
Presenter: Lab Manager or Quality Assurance Officer
Audience: Hospital Administrators, Investors
2. Biotechnology:
Use: Report on R&D efficiency and cost management to stakeholders
Presenter: Research Director or Operations Manager
Audience: Shareholders, Partners
3. Pharmaceuticals:
Use: Illustrate the effectiveness and expense control in drug testing labs
Presenter: Quality Control Specialist or Financial Analyst
Audience: Executives, Regulatory Agencies
4. Environmental Services:
Use: Show turnaround and precision in environmental sample testing
Presenter: Environmental Analyst or Lab Coordinator
Audience: Government Bodies, Environmentalists
5. Food and Beverage Manufacturing:
Use: Assess food safety testing times and accuracy for quality assurance
Presenter: Quality Assurance Manager or Production Supervisor
Audience: Food Safety Inspectors, Suppliers
6. Forensics:
Use: Communicate the performance metrics of crime lab analyses
Presenter: Forensic Lab Director or Criminalist
Audience: Law Enforcement, Judiciary Members
7. Academic Research Institutions:
Use: Share statistics about experimental test efficiency and reliability
Presenter: Head of Research Department or Principal Investigator
Audience: Funding Agencies, Academic Peers
Laboratory kpi for test turn around time total costs test accuracy ppt slide with all 6 slides:
Engage energetically with our Laboratory Kpi For Test Turn Around Time Total Costs Test Accuracy Ppt Slide. Make the experience an exhilirating one.


FAQs for Laboratory kpi for test turn around time total costs test
So honestly, I'd start with turnaround time and daily sample throughput - those are your bread and butter metrics. Error rates matter tons too, obviously. Equipment downtime will make or break your day, trust me on that one. Management always wants to see cost per test numbers, so track that for sure. If you've got external clients, customer satisfaction scores help too. Don't go crazy measuring everything though - pick maybe 4 or 5 that actually relate to your biggest headaches. Figure out where you're at now, then set targets you can actually hit. Focus on whatever's causing you the most pain first.
Yeah, lab KPIs totally depend on what you're actually doing. Clinical labs are all about speed and accuracy - patients need results fast and they better be right. Research labs? They're tracking publications, grants, whether experiments can be repeated (which honestly is harder than it sounds). QC labs obsess over catching defects and staying compliant since they're basically the last line of defense. Don't just copy what other labs measure though. Pick maybe 3-5 metrics that actually matter for YOUR specific goals, not what looks good on paper.
So KPIs are like your early warning system for compliance stuff. Track things like calibration schedules, how complete your documentation is, safety incidents, quality control pass rates - you know, the basics. They catch problems before auditors show up at your door, which honestly saves so much stress. Pick metrics that actually match your regulatory standards (FDA, ISO, whatever you're dealing with). I'd start small - maybe 3 or 4 key ones you check monthly. Way better than that last-minute panic when audit season rolls around. Trust me on this one.
Track from when samples arrive until reports go out - that's your real turnaround time. Most LIMS systems can set up automated timestamps at key spots like accessioning, testing, review, and release. Honestly way better than doing it manually. Different tests need different benchmarks though - a CBC is obviously faster than cultures. I'd start by measuring what you're actually doing now, then figure out where the bottlenecks are. Monitor daily averages and flag anything weird right away. Set targets based on real data, not what sounds good on paper. Once you know your problem areas, you can actually fix them.
Honestly, start by mapping out your current workflow and just cut the stuff that's slowing you down. Train your team better too - especially on newer equipment. Weekly KPI meetings are a total game changer instead of waiting around for monthly reports. Oh and don't get sucked into buying fancy tech when sometimes you just need people talking to each other better lol. Regular quality checks help catch issues early. Use your data to spot problems before they blow up. Quick course corrections beat playing catch-up every time.
Look, happy employees literally make your lab run better - better accuracy, faster results, less mistakes. People who don't hate their job are way more careful with samples and procedures. Track your usual stuff like error rates and turnaround times, but also watch turnover, sick days, and whether people actually finish training. Quarterly surveys help catch problems before they explode. Honestly, it's pretty obvious once you think about it - labs with engaged teams crush their targets while the burnout places are constantly scrambling. You'll see the connection once you start measuring both things together.
Start with LIMS if you can - they're made for lab work and track most stuff automatically. Power BI and Tableau are great for custom dashboards, though honestly Excel works fine for smaller setups. Gets chaotic quick with big datasets though. Real-time monitoring? Check out LabWare or Thermo Fisher's platforms. The trick is finding something that plays nice with your current equipment without being ridiculously complicated to use. I'd say list your key KPIs first, then demo maybe 2-3 options. See what actually fits how you work.
Think of KPIs as your workflow detectives - they'll show you exactly where things are getting jammed up. Track stuff like how long sample prep takes, equipment downtime, turnaround times by department. Say your sample prep suddenly takes forever but analysis stays normal - bingo, there's your culprit. Way easier than playing guessing games until someone starts yelling about delays (been there). Map out your main processes first, then time each step. The bottlenecks practically jump out at you. Honestly, I wish I'd started doing this sooner at my last job.
So honestly, start with the big three: cost per test, revenue per test, and your profit margins. Labor usually eats up most of your budget anyway, so definitely watch cost per FTE and how productive everyone's being. Equipment utilization is huge too - nothing worse than expensive machines just sitting there doing nothing. Oh, and don't forget about your revenue cycle stuff like days in AR and collection rates. That's especially brutal if you're dealing with insurance headaches. I'd stick with these basics first - you can always get fancier with your dashboard later once you've got the foundation down.
So for benchmarking lab KPIs, I'd start with industry reports from CAP, ISO, or whoever does your accreditation - they usually have anonymized performance data you can dig into. Professional associations are solid too, plus they sometimes have benchmarking studies you can join. Conference networking is honestly where I've gotten some of my best intel though - people are way more open about their real numbers over drinks! Focus on the usual suspects: turnaround times, error rates, cost per test. Most labs track these anyway. Pick maybe 3-5 KPIs that actually matter for your setup, then hit up your network or see if your lab management system has benchmarking built in.
Look at your actual numbers from the last 6-12 months first - that's your real starting point. I made the mistake once of setting crazy high targets that just crushed morale. Factor in downtime for equipment breaks, training days, and those random audits that always seem to pop up at the worst times. Your targets need to match what your team can actually handle with current resources. Oh, and don't forget seasonal stuff if that affects your lab. The key thing though? Get your team involved in setting these numbers since they're doing the actual work anyway.
Data analytics can help you spot patterns in your KPIs that monthly reports totally miss. I'd start by setting up automated dashboards pulling real-time data from your LIMS and other systems. You'll get instant visibility into turnaround times, error rates, all that stuff. Then you can start connecting dots - like how staffing levels affect quality scores or which instruments are always causing delays. Predictive analytics is pretty cool too, lets you see bottlenecks coming. Honestly though, don't try to do everything at once. Pick one or two key metrics first and build from there.
QA is like the foundation for any lab KPIs that actually matter - without it you're just looking at random numbers that don't mean much. It helps you figure out what processes to track and sets realistic performance standards. Plus it keeps your measurement methods consistent (trust me, inconsistent data is the worst). Your QA team should catch when KPIs start drifting or when outside stuff messes with results. We learned this the hard way at my old job. Start with quarterly reviews of existing KPIs to make sure they're still tracking what you care about.
Stop chasing individual metrics - you'll drive yourself crazy. Instead, group your KPIs into buckets: quality, efficiency, safety, customer satisfaction. Pick 2-3 indicators from each area. Here's the thing though - set realistic targets that don't compete with each other. Push turnaround times too hard and accuracy goes to hell (trust me on this one). Get a dashboard showing all categories together so you catch those trade-offs early. Weekly team reviews work best for figuring out what needs focus and shifting priorities around.
Honestly, customer satisfaction metrics are probably the most telling KPIs for any lab. Track your turnaround times, accuracy ratings, and how well you communicate with clients. Basic stuff works best - don't overcomplicate it with fancy Net Promoter Scores unless you're really into that. The real value comes from spotting gaps between what you think you're delivering and what clients actually experience. Survey them regularly, then use that feedback to fix actual problems. Like if everyone's complaining about slow results, that's your cue to focus on efficiency metrics instead of just guessing what matters.
-
Perfect template with attractive color combination.
-
Visually stunning presentation, love the content.