

Maintenance Dashboard Snapshot Of Service Companies




Try Before you Buy Download Free Sample Product
 Impress Your
 Audience
 100%
100% Editable
 Save Hours
 of Time


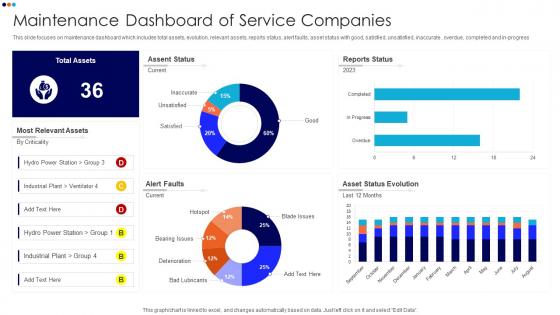
This slide focuses on maintenance dashboard which includes total assets, evolution, relevant assets, reports status, alert faults, asset status with good, satisfied, unsatisfied, inaccurate , overdue, completed and in progress.
People who downloaded this PowerPoint presentation also viewed the following :
Maintenance Dashboard Snapshot Of Service Companies with all 7 slides:
Use our Maintenance Dashboard Snapshot Of Service Companies to effectively help you save your valuable time. They are readymade to fit into any presentation structure.





FAQs for Maintenance Dashboard Snapshot
Honestly, start simple with your dashboard - uptime/downtime tracking and MTBF/MTTR are absolute must-haves. Those show you what's actually happening. Work order completion rates matter too, plus your backlog levels so you don't get swamped. I'd probably add preventive maintenance compliance and maybe total costs as percentages. That's like 5-6 metrics tops. Don't go crazy adding fancy charts right away - I've seen people do that and they never actually use half of it. Get good at checking these basics daily first, then you can always add more later.
Dude, you'll catch problems way before they turn into expensive nightmares. Your dashboard shows equipment trends, temp spikes, vibration issues - all happening live instead of waiting for those boring scheduled reports. No more detective work with old data! You can actually see which machines need help first and send your team where they're needed most. Honestly beats making maintenance decisions based on hunches. Oh, and set up alerts for the critical stuff so it watches things even when you're grabbing coffee or whatever.
Prioritize your urgent alerts and KPIs right at the top - that's what people need to see first. Red for critical stuff, yellow for warnings, green for all good. Don't go crazy with metrics everywhere (I swear some dashboards hurt my eyes). Clean charts work better than fancy ones that take forever to understand. Speed matters too since field techs are usually pulling this up on tablets. Oh, and definitely test with real users first - you'd be surprised what doesn't make sense to other people.
So there's a few ways to connect your maintenance dashboard to the ERP. APIs are probably your best bet - SAP and Oracle have decent ones that pull real-time data like work orders and inventory. Direct database connections work too but they're messier. Honestly, you'll need IT unless you find some plug-and-play option. The tricky part is mapping all your data fields so nothing gets duplicated or lost. I'd start by listing exactly what data needs to flow between systems first. Then pick your method based on what your team can actually handle.
Dude, mobile access can make or break your maintenance dashboard. Your team's constantly moving around - they're not glued to computers like office workers. They need to check work orders while standing next to a broken machine, you know? Without decent mobile access, they'll just wing it and try to remember stuff until they get back to a computer. Which obviously doesn't work. Some of these dashboard apps are pretty terrible on phones though. Find one with either a solid mobile app or at least a website that doesn't look like garbage on smaller screens.
So basically predictive analytics flips your maintenance dashboard from "oh crap, it's broken" to "heads up, this might break next week." It looks at sensor data, how much you've used equipment, even weather patterns to spot trouble before it hits. Honestly, the timing predictions can be scary accurate. You get alerts weeks ahead instead of scrambling when something dies during your busiest day - which always happens, right? Schedule repairs when it's convenient, dodge those nightmare emergency calls. Start with your most critical stuff and get some sensors on there to build up data.
Honestly, data integration is gonna be your biggest headache. All your maintenance info is spread across different systems and they hate talking to each other. Bad data quality will make your whole dashboard pointless too - classic garbage in, garbage out situation. Getting your techs on board is tricky since nobody loves changing how they work. Plus figuring out which metrics actually matter to different people? That's harder than it sounds. Oh, and don't try to boil the ocean right away. Pick one data source, maybe three solid KPIs, then build from there once people see it's not just another corporate pet project.
Yeah, you can totally customize those dashboards - just swap out the KPIs and visuals for what actually matters in your field. Manufacturing? Focus on uptime and production numbers. Healthcare needs compliance stuff and safety metrics instead. The flexibility is honestly pretty solid these days. Change your alert settings, throw in industry-specific forms, connect it to whatever software you're already using. Don't just grab generic templates though - that's where people mess up. Figure out your top 5 headaches first, then build around fixing those. Way more useful that way.
Start with your CMMS - that's got all your work orders and maintenance schedules. ERP systems have your inventory and cost data. IoT sensors are great if you've got them, same with condition monitoring stuff like vibration sensors. Honestly, don't sleep on those manual inspection logs either - sometimes they catch weird things the fancy sensors totally miss. Your production systems can feed in downtime metrics too. Just don't go crazy trying to connect everything at once though. Pick 3-4 main sources first. Way easier to add more later than dealing with data chaos from day one.
Honestly, just ask your maintenance teams what they actually use - half those fancy charts you spent time on? Total waste of space. I'd set up quick surveys and watch the usage data to see what gets ignored. The heavy users will tell you exactly what's broken. Maybe alerts go off too much, or they can't find info without clicking around forever. Run some A/B tests on layouts if you want to get fancy about it. But seriously, the people who live in that dashboard every day know what sucks. Listen to them and actually fix their complaints - they're doing you a favor by being honest.
Look, you definitely want to track MTBF and MTTR - basically how often stuff breaks and how fast you fix it. OEE gives you the bigger picture too. I'd also keep tabs on planned vs unplanned downtime because that's where you'll catch patterns before they bite you. Oh, and break it down by equipment type and root causes. That way you're not just throwing money at random maintenance issues - you can actually see what's causing the most problems and focus there first. Trust me, the categorizing part makes a huge difference.
Honestly, good visuals can totally change how your team uses those dashboards. Nobody wants to stare at endless spreadsheet rows - it's like digital torture. Charts and graphs make people actually *want* to check the data. You'll see your maintenance crew engaging way more when they can instantly spot what needs fixing. Simple bar charts work great for work orders, and trend lines show equipment performance over time. The visual stuff helps them catch problems and patterns super quick. I'd start basic though - don't go crazy with fancy graphics right away.
Honestly, I'd go cloud unless you've got some crazy compliance stuff going on. You can access dashboards from anywhere - super helpful when your team's out in the field. Plus updates happen automatically, which is nice because nobody wants to deal with that headache. On-premises gives you more control over security and customization, but then you're stuck maintaining servers yourself. The scalability with cloud is way better too. Most places I've seen make the switch are pretty happy with it, though I know some old-school managers still prefer keeping everything in-house.
Honestly, maintenance dashboards are a game-changer for compliance stuff. Everything gets tracked automatically, so when auditors show up you're not digging through old paperwork like a madman. Real-time tracking means you'll actually know if you're hitting inspection deadlines and safety requirements. Plus generating reports takes like two seconds instead of hours. Set up alerts for upcoming deadlines though - trust me on this one. I've seen too many people miss critical inspections because they forgot. The dashboard basically becomes your proof that you did preventive maintenance, kept certifications current, all that regulatory nonsense they want to see.
Honestly, predictive maintenance is where it's at right now - dashboards that can spot problems weeks ahead instead of after stuff breaks. Your maintenance crews are always moving around, so mobile-first design is critical. IoT sensors are everywhere these days, pulling real-time data from every machine. AR overlays for field work are pretty cool too, though maybe not essential yet. I'd definitely run some pilot programs now with this stuff. Trust me, you don't want to be stuck playing catchup when your current system starts feeling ancient.
-
You know what? I'm so glad I opted for this PPT design. It has been a total game-changer for me and my presentations. Thank you!
-
Thanks for all your great templates they have saved me lots of time and accelerate my presentations. Great product, keep them up!