

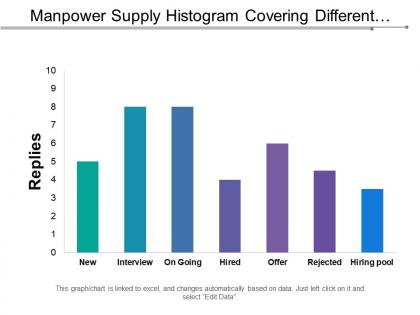
Manpower supply histogram covering different channel of recruitment of employees




Try Before you Buy Download Free Sample Product
 Impress Your
 Audience
 100%
100% Editable
 Save Hours
 of Time


Benefit from brainstorming with our Manpower Supply Histogram Covering Different Channel Of Recruitment Of Employees. Experiment with fresh and creative ideas.
People who downloaded this PowerPoint presentation also viewed the following :
Manpower supply histogram covering different channel of recruitment of employees with all 5 slides:
Ensure glory days again with our Manpower Supply Histogram Covering Different Channel Of Recruitment Of Employees. You will make a great comeback.


FAQs for Manpower supply histogram covering different channel of
Key components include time periods on the x-axis, employee headcount or FTE values on the y-axis, departmental or skill-based categorizations, seasonal variation indicators, and projected versus actual staffing levels. These elements enable organizations to visualize workforce trends, identify staffing gaps or surpluses, and optimize resource allocation across departments, ultimately delivering strategic workforce planning and enhanced operational efficiency.
Businesses can effectively analyze workforce data using histograms by visualizing employee distributions across age groups, salary ranges, experience levels, department sizes, and performance ratings. These visual tools streamline workforce planning by identifying staffing gaps, compensation imbalances, and skill distribution patterns, with many organizations finding that histogram analysis enhances strategic decision-making and optimizes resource allocation across departments.
Visualizing manpower supply trends through histograms offers clear pattern recognition, resource allocation insights, demand forecasting capabilities, bottleneck identification, and strategic workforce planning advantages. These visual tools enable organizations to streamline hiring processes, optimize staffing levels across departments, and anticipate seasonal fluctuations, with many companies finding that histogram analysis ultimately delivers improved operational efficiency and competitive workforce management.
Determining appropriate intervals for manpower supply histograms involves analyzing data range, sample size, and organizational requirements, typically using methods like Sturges' rule, square root choice, or Scott's normal reference rule. These statistical approaches help organizations visualize workforce distribution patterns, identify staffing gaps across departments, and optimize resource allocation, with many HR teams finding that 5-12 bins effectively balance detail with interpretability for strategic workforce planning.
The shape and distribution of a manpower supply histogram reveal critical workforce patterns including skill concentrations, experience levels, departmental allocation, seasonal availability, and resource gaps across organizational functions. These visual insights enable strategic workforce planning by identifying staffing bottlenecks, optimizing resource allocation, and predicting future hiring needs, with many organizations finding that histogram analysis streamlines recruitment strategies and enhances operational efficiency.
Histograms reveal staffing gaps by visually displaying workforce distribution across departments, skill levels, experience ranges, and time periods, making understaffed areas immediately apparent through data comparison. Organizations can analyze these patterns to identify critical shortages, plan strategic recruitment, and optimize resource allocation, with many companies finding that histogram analysis enables more targeted hiring decisions and improved operational efficiency.
Excel, Tableau, Power BI, R, and Python are most effective for creating manpower supply histograms, each offering varying levels of automation and analytical depth. Excel works well for basic visualizations, while Tableau and Power BI deliver advanced dashboard capabilities, and programming tools like R and Python enable sophisticated workforce analytics, with many HR departments finding that these platforms streamline resource planning and enhance strategic workforce decisions.
Manpower supply histograms inform future hiring strategies by revealing workforce distribution patterns, identifying skill gaps, predicting turnover trends, and highlighting seasonal demand fluctuations. These visual analytics enable HR teams to proactively plan recruitment cycles, optimize resource allocation, and develop targeted talent pipelines, with many organizations finding that data-driven hiring strategies reduce costs while improving workforce stability.
Demographic factors significantly influence manpower supply histograms through age distribution, education levels, geographic concentration, gender participation rates, and migration patterns. These variables reshape workforce availability across sectors, with aging populations reducing supply in manufacturing while educated urban demographics enhance technology and finance sectors, ultimately determining regional competitive advantages and strategic workforce planning needs.
Organizations ensure manpower supply histogram accuracy through regular data audits, standardized collection protocols, automated validation systems, and real-time database synchronization. These practices streamline workforce analytics by eliminating inconsistencies, reducing manual errors, and maintaining current records, with many HR departments finding that integrated platforms ultimately deliver more reliable insights and strategic workforce planning capabilities.
Common pitfalls include misreading scale intervals, ignoring seasonal variations, overlooking skill-level breakdowns, and failing to account for projected retirements or turnover rates. These interpretation errors can lead to significant workforce planning missteps, with many organizations finding that cross-referencing histogram data with departmental forecasts and industry benchmarks delivers more accurate resource allocation and strategic hiring decisions.
Histograms reveal seasonal manpower patterns by displaying workforce availability across monthly or quarterly intervals, clearly showing peak and low-demand periods through visual bar heights. Manufacturing companies and retail organizations use these visualizations to identify summer hiring surges or holiday staffing needs, enabling strategic workforce planning, optimized resource allocation, and proactive recruitment scheduling that ultimately reduces costs and maintains operational efficiency.
Historical data serves as the foundation for manpower supply histograms by revealing staffing patterns, seasonal fluctuations, turnover rates, and resource allocation trends across different periods and departments. Through analyzing past employment cycles, organizations can identify optimal staffing levels, predict future workforce needs, and strategically plan recruitment initiatives, with many companies finding that data-driven workforce planning reduces costs while enhancing operational efficiency.
Manpower supply histograms integrate into workforce planning by visualizing current staffing distributions, identifying skill gaps across departments, and forecasting future resource needs based on demographic trends. Organizations use these analytical tools to optimize recruitment strategies, plan succession initiatives, and align talent allocation with business objectives, ultimately enabling more strategic workforce decisions and improved operational efficiency.
Industries differ in their manpower supply histogram presentations through varying skill categorizations, experience level groupings, departmental breakdowns, geographic distributions, and seasonal workforce patterns. Manufacturing sectors typically emphasize technical certifications and shift allocations, while service industries focus on customer-facing roles and performance metrics, with healthcare and finance requiring specialized licensing categories that deliver targeted recruitment strategies and optimized resource allocation.
-
Good research work and creative work done on every template.
-
Best Representation of topics, really appreciable.