

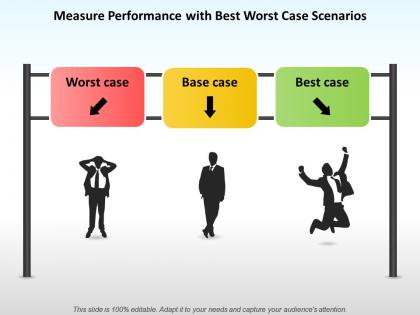
Measure performance with best worst case scenarios




Try Before you Buy Download Free Sample Product
 Impress Your
 Audience
 100%
100% Editable
 Save Hours
 of Time


Draw folks away from baseless arguments with our Measure Performance With Best Worst Case Scenarios. Bring all the jaw jaw to an end.
People who downloaded this PowerPoint presentation also viewed the following :
Measure performance with best worst case scenarios with all 5 slides:
Our Measure Performance With Best Worst Case Scenarios contain an exciting blend of colors. They generate a heady feeling.


FAQs for Measure performance with best
Pick KPIs that actually connect to your big goals - revenue growth, customer satisfaction, stuff like that. Financial metrics are obvious, but don't ignore things like employee engagement or customer acquisition cost since they tell you what's coming. Too many teams track literally everything and then can't make decisions because there's too much noise. Stick to maybe 5-7 key ones that leadership actually looks at each month. Each metric needs someone owning it and a clear benchmark. Oh, and nail those basics first before you get fancy with complex tracking. Trust me on this one.
Honestly, figure out what actually moves the needle in your specific industry first. Manufacturing cares about totally different stuff than hospitals or tech startups, you know? Like hospitals obsess over patient wait times while retail is all about inventory turnover. Don't just steal metrics from some random company - that's lazy and probably won't work anyway. Map out what your stakeholders actually care about, check any regulatory stuff you have to track, then build around that. Oh, and start small! Pick maybe 5-7 things you can actually do something about when the numbers change.
Honestly, tech just handles all the boring stuff so you don't have to. Instead of waiting months for reports, you'll see what's happening right now through dashboards. AI can even flag problems before they actually become problems - which is pretty wild if you think about it. Those visualization tools are a lifesaver when you're presenting to higher-ups too. Nobody wants to decode endless spreadsheets. My advice? Start small. Look at whatever you're tracking by hand right now and see if you can automate just those pieces first. Way less overwhelming that way.
Look, numbers only tell half the story. You might see a 90% completion rate and think everything's perfect, but then users tell you the whole process made them want to throw their laptop out the window. Surveys and interviews give you the "why" behind those metrics - like why people are actually struggling or what's making them happy. It's honestly game-changing when you combine both. Your dashboards show what's happening, but talking to real people explains the emotions and context you're totally missing otherwise. Just add one quick user check to your next review and you'll see what I mean.
Ugh, the classic mistake is tracking everything under the sun - you'll drown in useless data. Companies get obsessed with vanity metrics too, like page views when they should care about actual sales. Teams ignore the whole thing if leadership doesn't get their buy-in first. And don't even get me started on executives who change metrics every quarter because they're bored! Pick maybe 3-5 things that actually matter to your goals. Get everyone on board with why those specific numbers count. Then stick with them - I know it's tempting to switch, but you need time to spot real trends.
Oh man, this is such a real problem! Your Japanese team will totally downplay their wins while the US folks are out here overselling everything - makes comparing them completely pointless. Different cultures handle feedback and deadlines differently too, which throws off your usual metrics. Honestly, I learned this the hard way at my last job. Best thing you can do? Set up separate benchmarks for each culture. Train your managers to read between the lines instead of using the same cookie-cutter approach everywhere. What looks like underperformance might just be communication style.
Look, people actually give a damn about performance metrics when they mean something real - not just HR busywork. You want engagement? Show them how their daily grind connects to the big picture stuff that matters. Nobody wants to sit in the dark wondering if they're screwing up, then get blindsided at review time (been there, it sucks). Let your team help figure out what success looks like for them instead of just deciding for them. Honestly, just ask what would actually motivate them. It's wild how rarely managers do that basic thing.
Honestly, just start with regular check-ins where you actually *do* something with the data instead of letting it collect dust. Monthly works well - get your team together, look at what's happening, and talk through what needs tweaking. Make it a real conversation, not some boring one-way presentation that makes everyone zone out. Then actually change things based on what you learn (this is where most people drop the ball). Track whether your changes help or not. I'd pick just one metric to focus on first - trying to fix everything at once is a recipe for burnout.
Start with their annual reports and SEC filings - that's where the real numbers live. IBISWorld has solid industry comparisons too. Social media monitoring is surprisingly useful for tracking their engagement and what customers actually think. I'd also check out their job postings (tells you where they're expanding) and maybe do some mystery shopping if that makes sense for your industry. Third-party research firms publish competitive studies that can save you tons of work. Mix the hard data like revenue per employee with softer insights. Just pick 3-5 main competitors and track the same stuff monthly - don't go crazy trying to monitor everyone.
Dude, visualizing your data is a game changer. Those endless spreadsheet rows? Your brain wasn't made for that mess. Charts and graphs let you actually *see* what's happening - trends jump out, weird outliers become obvious. I'm telling you, our quarterly reviews used to be torture until we switched to dashboards. Now I can spot issues instantly and actually explain results without putting everyone to sleep. Bar charts, line graphs - doesn't matter if they're fancy. Even basic visuals beat staring at numbers in rows. Makes decisions so much easier when you can see patterns instead of hunting through cells.
Honestly, most people just slap SMART on their goals without actually thinking it through. You've gotta make each letter count for your situation. Instead of "improve sales," go with something like "boost Q3 revenue by 15%" - way more specific. Make sure you can actually measure it, that it's realistic given what you're working with, and that it connects to your bigger picture stuff. Oh, and set real deadlines, not just "soon." I've seen too many teams skip the upfront work here and then wonder why nobody knows if they're winning or not. Write it down, then go through each letter of SMART. If anything feels wishy-washy, keep tweaking until it's rock solid.
So basically, good performance measurement helps you figure out where to actually spend your money and time. You can see which projects are working versus the ones that just looked good in meetings (honestly, we've all backed those duds before). The trick is tying your data to real business wins - like noticing customer retention jumped 15% after you invested in support training. Track the right stuff and you'll build a solid case for what deserves more resources. Plus you'll know when to kill projects that aren't delivering.
Honestly, the hardest part is you can't just walk over and see what people are actually doing. Managers freak out about this and start micromanaging like crazy. Time zones are a nightmare for quick check-ins, and you miss all those random conversations that actually get stuff done. It's way harder to tell when someone's having a rough time or if the team vibe is off. Oh, and forget tracking hours - that's pointless. Set clear deliverables instead and focus on what people actually produce, not how long they sit at their computer.
Build flexibility into your measurement setup from day one. Mix stable metrics (customer satisfaction, etc.) with adaptable ones you can shift quarterly when markets change. Most companies are painfully slow here - they're still tracking last year's goals while everything's moved on. Regular review cycles are clutch so you can pivot fast when strategies shift. Oh, and make sure your systems can handle new indicators without nuking all your historical data. That's bitten me before. The trick is staying nimble without losing continuity.
Look, fairness and transparency are huge here. Don't let your metrics accidentally screw over certain groups - I've seen that happen and it's messy. Be upfront about what you're tracking and why, because secret scorecards make everyone paranoid. Also think about how all this monitoring affects people's mental health and whether they actually trust you. Honestly, constant surveillance can backfire pretty hard. Try auditing your current setup for bias first, then loop your team into conversations about what fair measurement actually looks like to them.
No Reviews