

Multiple Project Budget Status Report Template





Try Before you Buy Download Free Sample Product
 Impress Your
Audience
 100%
Editable
 Save Hours
of Time


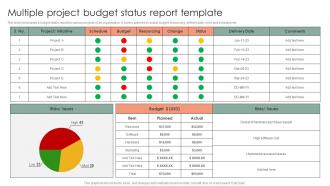
The slide showcases a budget status report for various projects of an organization. It covers planned vs actual budget, resourcing, delivery date, risks and schedule etc.
People who downloaded this PowerPoint presentation also viewed the following :
Multiple Project Budget Status Report Template with all 7 slides:
Use our Multiple Project Budget Status Report Template to effectively help you save your valuable time. They are readymade to fit into any presentation structure.






FAQs for Multiple Project Budget
So you'll need actual vs budgeted numbers for each line item - both dollar amounts and percentages. Year-to-date stuff plus what's left in the period. Write up why big variances happened (like that marketing spike last month). Revenue performance and expense breakdowns are obvious musts. Honestly, charts make everything look more professional even if the data's straightforward. Don't forget your forecast for the rest of the year and any budget changes you made. The goal? Anyone should be able to glance at it and know if you're hitting your targets or not.
Basically, budget variations show you where your money's actually going vs where you planned to spend it. If you're constantly overspending in certain areas, you've got two choices - bump up those budget lines or figure out how to rein in costs. Underspending can mean you missed opportunities or your projections were just way off. I'd honestly start by looking at your top 3 problem categories and really dig into why they're happening. The whole point is spotting these patterns early so you can adjust next period's budget instead of scrambling to fix things after the fact.
Track three main things: variance between actual and budget, what percentage you've burned through, and your spending rate. Forecast accuracy from past periods is huge too - shows you if your predictions are actually worth anything. Monthly timing matters even if you're on track yearly, which people forget about. Your department heads like seeing both dollar amounts and percentages since they process numbers differently. Oh, and start simple with these basics first. You can always get into the weedy details later once everyone's comfortable with the routine.
Look, forget drowning them in numbers - explain WHY the variances happened. Hit the big stuff first since that's what actually matters to them. Skip the finance speak too (trust me, acronyms just annoy people). For each variance, give them three things: what went down, the reason behind it, and your plan to fix it. Charts are fine but don't go crazy. Oh, and never just dump problems on them - always bring solutions they can actually do something with. Makes you look way more on top of things.
Don't be vague with your variances - that's the biggest mistake I see. People just throw numbers around without explaining WHY things changed. Honestly drives me crazy. Also, don't wait until the last second to pull everything together. I learned that one the hard way! Make sure you're actually comparing the right things (budget vs actual periods need to match). Always throw in a forecast too because everyone wants to know what's coming next, not just what already happened. Oh, and create some basic template so you're not reinventing the wheel every month.
Honestly, tech has been a game-changer for our budget reports. Automated data collection cuts out so many manual errors - you know how easy it is to fat-finger numbers at 5pm. AI tools now catch weird variances that I'd totally miss when things get crazy. Real-time syncing with accounting systems means no more spreadsheet disasters (thank god). The reconciliation stuff happens instantly across different sources too. Oh, and you actually get to spend time figuring out what the numbers mean instead of just fixing mistakes all day. Way better use of time.
Look, forecasting is what separates a useful budget report from just looking at old numbers. Take your current spending and project it out - where will you actually be by December? Most people totally phone this part in, but it's honestly the whole point. You can't catch problems or find savings if you're only seeing what already happened. Your boss needs to know what's coming, not just what's done. I learned this the hard way when I missed a huge overrun that was totally predictable. Base your projections on real trends, not what you hope will happen.
Create a separate section just for the unexpected stuff - don't hide it in your regular budget lines. For each surprise expense, explain what it was, how much it cost, and if you'll see it again next month or if it's done. Honestly, adding a column that shows your remaining budget is a game changer because you can instantly see how screwed (or safe) you are. Be upfront about what went wrong and your plan to avoid it happening again. Oh, and definitely highlight anything that might push you over your total budget limit.
Dude, you NEED historical data as your baseline - it's literally everything in budget reporting. Shows you patterns and what's actually normal for your company. That 15% variance? Could be a disaster or just regular Q3 stuff. I freaked out my first year over what was totally normal cyclical spending lol. Once you have solid context, spotting real problems becomes way easier. You'll predict performance better too. Honestly, the forecasting gets so much more accurate. Start tracking everything now so next year you're not scrambling to figure out what the hell is happening.
Honestly, charts and graphs are a total game-changer for budget reports. Bar charts showing actual vs budgeted? Perfect. I always do the traffic light thing too - green for good, yellow for watch out, red for oh crap. Way better than drowning people in spreadsheet hell. Pie charts work well for category breakdowns, though I probably overuse them. The goal is stakeholders getting your main points in like 30 seconds. Once they can scan and immediately see what's working and what's not, you're golden.
Honestly, you'll want to check in on your budget way more often than most people do - weekly or every two weeks works best. Don't wait until month-end when it's already too late to fix anything. I always build in some cushion because random expenses pop up constantly (learned that the hard way). Set alerts at like 50% and 75% of your budget so you get a heads up. The whole point is catching problems early before you're scrambling. Track your actual spending against what you planned pretty regularly. Maybe start with just one number you'll watch more closely this week and go from there.
Look, monthly reports are the bare minimum but honestly quarterly feels more realistic for most teams. Monthly can get annoying fast. Do monthly check-ins with your team leads though, then quarterly deep dives with stakeholders. High-spend periods or year-end? Go bi-weekly for sure. The biggest thing is actually being consistent - I've seen too many people do random reports only when their boss asks. Just pick something and stick with it. Oh and set up those recurring calendar invites right now or you'll totally forget.
Dude, skip the spreadsheets - people's eyes will literally glaze over. Charts and graphs are your best friend here. Say "over budget" instead of weird finance terms like "negative variance." Nobody cares about that jargon anyway. Start with the big picture: are we good, bad, or somewhere in between? Then get specific about how it affects their actual projects. Context matters too - explain why things went sideways and what you're doing to fix it. Oh, and always end with clear action items so people know what's next.
Honestly, these software tools will save your sanity when you're trying to pull budget data from everywhere. Instead of hunting down people for spreadsheet updates (ugh), you can set up automatic collection from different departments and systems. Power BI and Tableau are solid picks - they'll standardize all your messy formats and knock out duplicates. Real-time dashboards are pretty sweet too since everything updates by itself. Even Excel works if you get fancy with it. I'd figure out where your main data lives first, then grab whatever tool plays nice with your current setup.
Economic shifts mess with budgets in ways you wouldn't expect. Inflation hits and suddenly your cost projections are way off. Market volatility means you're constantly second-guessing revenue forecasts instead of doing quarterly check-ins like normal. Supply chain issues throw everything into chaos - honestly, it's why I always pad my numbers now. Interest rate changes don't help either. The trick is building in bigger buffers from the start and calling out which parts of your budget are most vulnerable to economic weirdness. That way your team isn't scrambling when variances show up.
-
One-stop solution for all presentation needs. Great products with easy customization.
-
Loved the templates on SlideTeam, I believe I have found the go to place for my presentation needs!