


Natural resource management of water powerpoint presentation slides




Try Before you Buy Download Free Sample Product
 Impress Your
 Audience
 100%
100% Editable
 Save Hours
 of Time


Introducing Natural Resource Management Of Water PowerPoint Presentation Slides which will assist in developing, distributing, and managing the optimum use of water resources. Take advantage of our readily available water testing PPT visuals, and discuss the six main indicators of the water quality. This water resource management PPT slide deck can be used by the department of water for analyzing information about water quality and to underpin decisions about water resource management. The water quality section will help you understand sources of water pollution, natural and human processes affecting water quality. Give a brief overview of the optimization of deterioration in water quality and pollutants that deteriorate water quality on a global scale with the help of our water quality management PowerPoint infographics. You can also showcase the wastewater treatment according to various industry types by utilizing these water quality monitoring PowerPoint slides. Describe how you can monitor and assess the water quality in order to manage the water resources. Highlight the trends that can influence the water industry in the future. You can design monitoring programs by describing monitoring types, monitoring areas, considerations while selecting the sampling site, frequency, and time of sampling etc by downloading this readily available water quality monitoring PPT slides.
People who downloaded this PowerPoint presentation also viewed the following :
Content of this Powerpoint Presentation
Slide 1: This slide displays Natural Resource Management Of Water. State your Company name and begin.
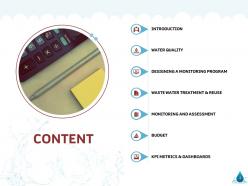
Slide 2: This slide displays Content of the presentation.
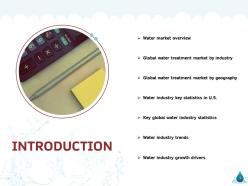
Slide 3: This slide showcases Water market overview.
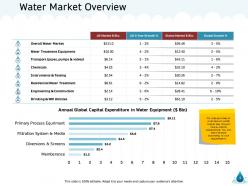
Slide 4: This slide provides an overview on water market size, Growth rate & capital expenditure. You can edit the data according to your requirements.
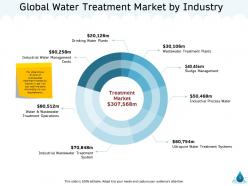
Slide 5: This slide shows division of wastewater treatment market by industry type. You can edit the data according to your requirements.
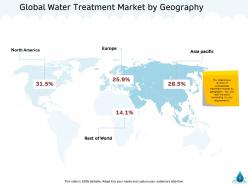
Slide 6: This slide shows division of wastewater treatment market by geography. You can edit the data according to your requirements.
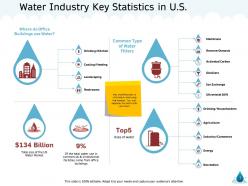
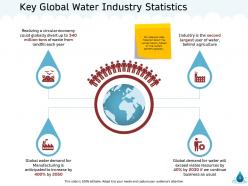
Slide 7: This slide depicts Water Industry Key Statistics in U.S.
Slide 8: This slide provides forecast about the water industry based on the current patterns globally.
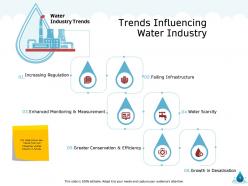
Slide 9: This slide shows key trends that will influence water industry in future.
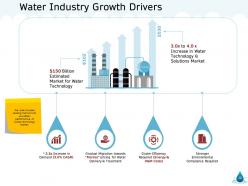
Slide 10: The slide includes leading factors that will affect performance of water technology market.
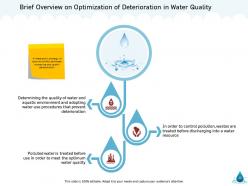
Slide 11: This slide provides Brief overview on optimization of deterioration in water quality
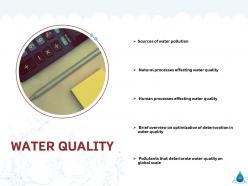
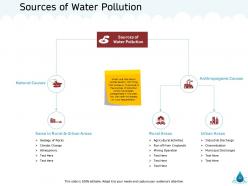
Slide 12: This slide shows Sources of Water Pollution.
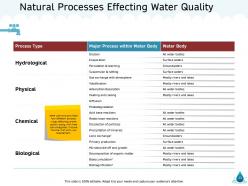
Slide 13: This slide showcases Natural Processes Effecting Water Quality.
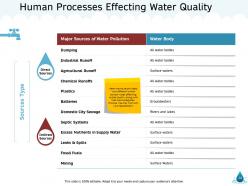
Slide 14: This slide shows Human Processes Effecting Water Quality.
Slide 15: This slide presents Brief Overview on Optimization of Deterioration in Water Quality.
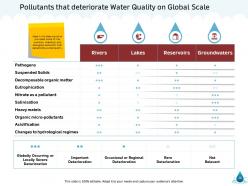
Slide 16: In this slide we have provided some of the common chemical and biological pollutants that deteriorate water quality.
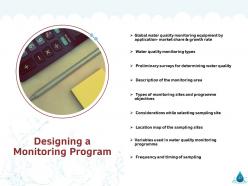
Slide 17: This slide provides information regarding Designing a Monitoring Programme
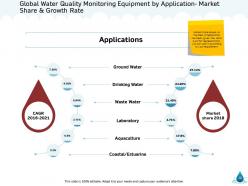
Slide 18: This slide depicts Global Water Quality Monitoring Equipment by Application- Market Share & Growth Rate
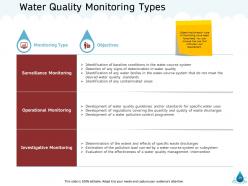
Slide 19: This slide showcases Water Quality Monitoring Types.
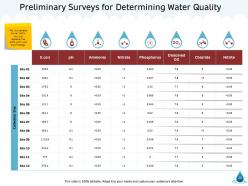
Slide 20: This slide depicts Preliminary Surveys for Determining Water Quality
Slide 21: This slide includes environmental features that describe the suitable location for monitoring programme.
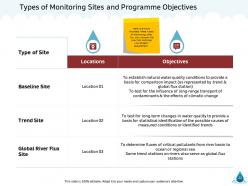
Slide 22: This slide showcases Types of Monitoring Sites and Programme Objectives.
Slide 23: This slide depicts Considerations while selecting Sampling Site.
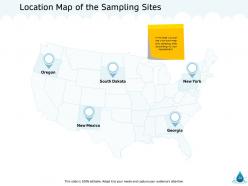
Slide 24: In this slide you can use your own map and sampling sites according to your requirement.
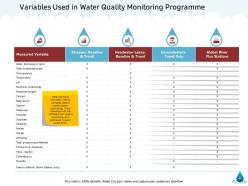
Slide 25: This slide showcases Variables Used in Water Quality Monitoring Programme
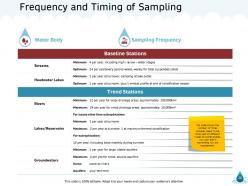
Slide 26: This slide shows the number of times samples need to be analysed for different types of water bodies. You can edit it according to your requirement.
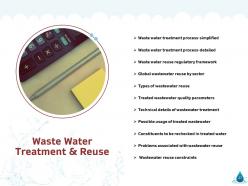
Slide 27: This slide showcases Waste Water Treatment & Reuse
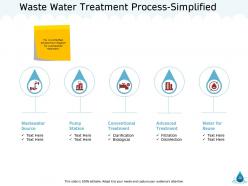
Slide 28: This slide presents Waste Water Treatment Process-Simplified.
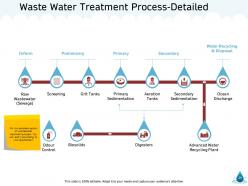
Slide 29: This slide depicts Waste Water Treatment Process-Detailed
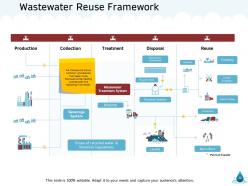
Slide 30: The framework shows common procedures that need to be followed while treating wastewater and disposing it for reuse.
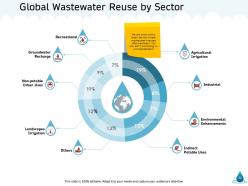
Slide 31: The pie chart in the slide shows major sectors where wastewater is reused after treatment. You can edit it according to your requirements.
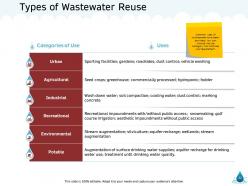
Slide 32: This slide shows Types of Wastewater Reuse
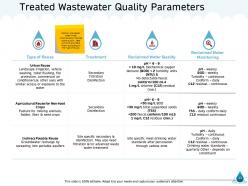
Slide 33: This slide displays Treated Wastewater Quality Parameters.
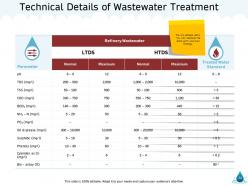
Slide 34: This slide showcases Technical Details of Wastewater Treatment.
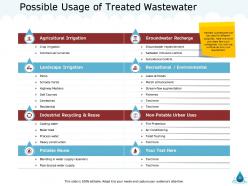
Slide 35: This slide displays Possible Usage of Treated Wastewater
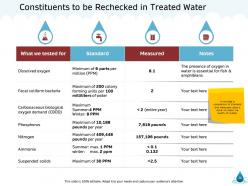
Slide 36: This slide shows comparison of standard and measured data is done to check the quality of water.
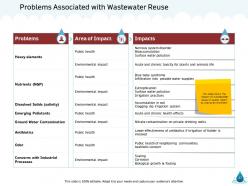
Slide 37: This slide presents Problems Associated with Wastewater Reuse
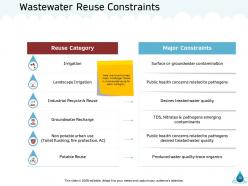
Slide 38: This slide showcases Wastewater Reuse Constraints
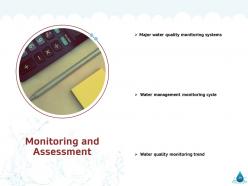
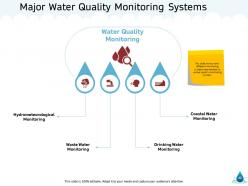
Slide 39: This slide showcases Major water quality monitoring systems.
Slide 40: This slide shows how different monitoring systems are related to water quality monitoring system.
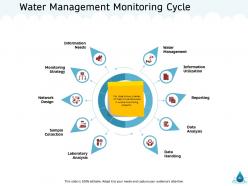
Slide 41: This slide shows a series of steps to be followed in water monitoring projects.
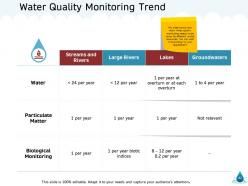
Slide 42: This slide shows how many times quality monitoring needs to be done for different water resources. You can edit it according to your requirement.
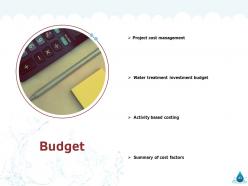
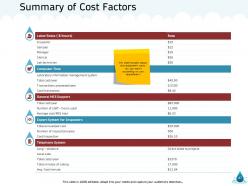
Slide 43: This slide displays Summary of cost factors
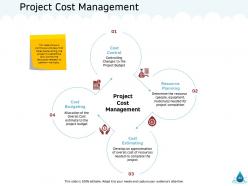
Slide 44: This slide shows a continuous process that takes place during the project to determine and control the resources needed to perform the tasks.
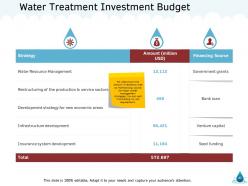
Slide 45: This slide shows the amount invested as well as the financing source for major water management strategies. You can edit it according to your requirements.
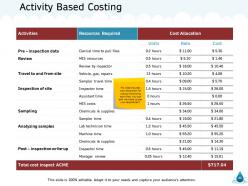
Slide 46: This slide includes cost allocation for various monitoring activities. You can edit the table as per your requirement.
Slide 47: This slide includes labour and equipment costs. You can edit it according to your requirement.
Slide 48: This slide showcases KPI Metrics & Dashboards
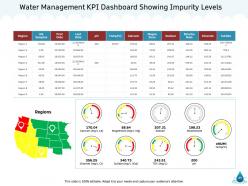
Slide 49: This slide displays Water Management KPI Dashboard Showing Impurity Levels
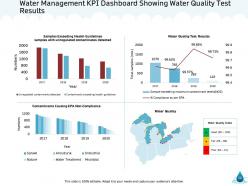
Slide 50: This slide showcases Water Management KPI Dashboard Showing Water Quality Test Results
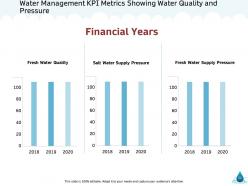
Slide 51: This slide depicts Water Management KPI Metrics Showing Water Quality and Pressure
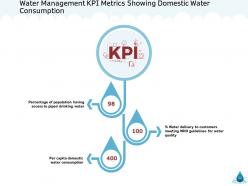
Slide 52: This slide showcases Water Management KPI Metrics Showing Domestic Water Consumption
Slide 53: This slide is titled as Additional Slides for moving forward.
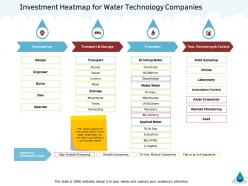
Slide 54: This slide shows Investment Heatmap for Water Technology Companies
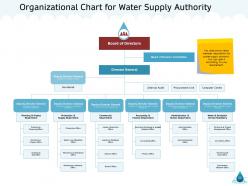
Slide 55: This slide shows Organizational Chart for Water Supply Authority
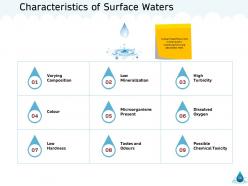
Slide 56: This slide displays Characteristics of Surface Waters
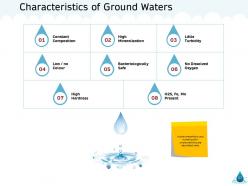
Slide 57: This slide showcases Characteristics of Ground Waters
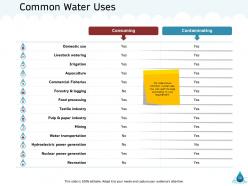
Slide 58: This slide shows common water uses. You can edit this slide according to your requirement.
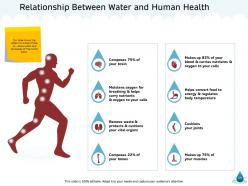
Slide 59: This slide shows the effect of water intake on various parts and processes of the human body.
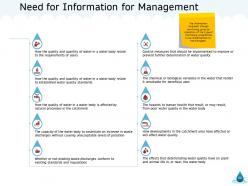
Slide 60: This slide displays Need for Information for Management
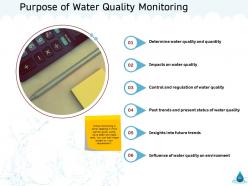
Slide 61: This slide shows Influence of water quality on environment.
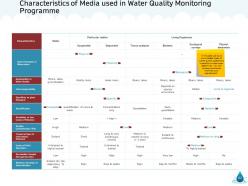
Slide 62: This slide depicts Characteristics of Media used in Water Quality Monitoring Programme
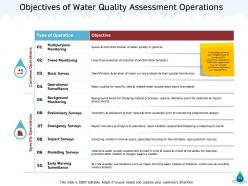
Slide 63: In this slide we have summarized types of water quality operations in relation to their main objectives. You can choose whichever matches your requirement.
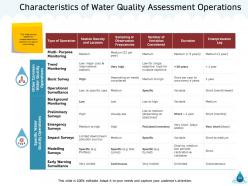
Slide 64: This slide shows operation characteristics in relation to type of monitoring.
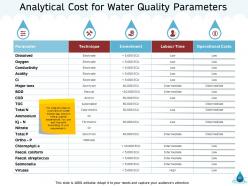
Slide 65: This slide shows Analytical Cost for Water Quality Parameters.
Slide 66: This is Natural Resource Management Of Water Icons Slide
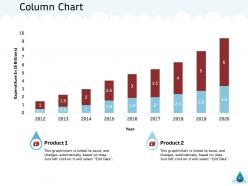
Slide 67: This slide displays Column Chart for comparison of products.
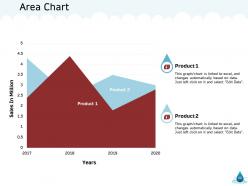
Slide 68: This slide depicts Area Chart for Comparison of products.
Slide 69: This is Idea Generation slide to highlight important content and facts.
Slide 70: This slide shows Target
Slide 71: This slide depicts Timeline process.
Slide 72: This is Thank You slide with Contact details.
Natural resource management of water powerpoint presentation slides with all 72 slides:
Use our Natural Resource Management Of Water Powerpoint Presentation Slides to effectively help you save your valuable time. They are readymade to fit into any presentation structure.


FAQs for Natural resource management of water
Water management is such a mess right now. Climate change has everything all over the place - droughts one year, massive flooding the next. Our pipes and treatment plants are ancient and falling apart. More people means everyone's fighting over the same water supply, and contamination from farms and factories isn't helping. I swear it feels like fixing one problem just creates two more. Best thing you can do? Map out what water issues your area actually faces first. Then get different groups working together - cities, businesses, whoever. You can't tackle this stuff alone.
Smart sensors are honestly where it's at for water systems - they'll catch leaks before you're dealing with a massive headache. Real-time monitoring gives you pressure and flow data across everything. Machine learning can predict when people need more water and adjust automatically, cutting waste by like 30%. IoT sensors sound fancy but they're total lifesavers for spotting problems early. Digital twins let you test changes without messing up actual service (pretty cool concept if you ask me). I'd start with mapping what you've got digitally, then throw some basic sensors at your main junction points.
Dude, local communities are everything for water management. They're literally living with these decisions daily, so they know what actually works. Their ground-level knowledge about water patterns and usage beats any outside expert's theory. Without their support, your whole plan crashes anyway - learned that the hard way from some failed projects I've seen. Communities can handle the monitoring, conservation, infrastructure upkeep, all that stuff. But here's the thing: you gotta involve them from day one in planning. Don't just hand down rules from above. Ask what they're already seeing and doing first. You'll be surprised how much they know.
So climate change is screwing with water in the weirdest ways - we're getting hit with both droughts AND crazy flooding at the same time. Makes zero sense but here we are. Hot weather makes water evaporate faster from reservoirs and stuff. Then when rain finally comes, it's like these massive downpours that flood everything and pick up tons of nasty runoff. Oh, and sea levels rising means salt water's creeping into freshwater supplies near coasts. Honestly, we just need water systems that can roll with whatever gets thrown at them.
Honestly, start with closed-loop systems and swap out the nastiest chemicals if you can. Treatment facilities are pricey but trust me - way better than dealing with regulatory headaches later. Monitor your discharge points religiously and train everyone on spill protocols. Oh, and separate your waste streams instead of mixing everything together - makes treatment so much more efficient. Set up regular audits to catch problems early. I've seen too many companies get burned by being reactive instead of staying ahead of issues. The upfront investment sucks but it's worth it.
Honestly, it's all about being smarter, not just using less water. Drip irrigation is a game changer - gives crops exactly what they need. Soil moisture sensors are pretty neat too, basically tell you when to water instead of guessing. Weather-based scheduling prevents that whole "oops I overwatered" thing. Drought-resistant crops help obviously, and cover crops keep moisture in the soil longer. The trick is showing farmers how this stuff actually saves them money while boosting yields. Nobody wants to feel like they're being forced into anything, you know? Start by figuring out where your water's going first though.
Dude, rainwater harvesting is actually pretty sweet - cuts your water bill and gives you backup water for the garden. Most systems pay for themselves in like 5-10 years depending on your area's rainfall and water rates. Plus you're helping reduce flooding from all that runoff, which is cool I guess. The setup isn't as complicated as it sounds either. I'd measure your roof area first to see how much water you could collect. Oh, and definitely check if your city offers rebates - mine had this program that basically cut the cost in half. It's one of those things that just makes sense, especially with how crazy water prices are getting.
Water disputes between countries are honestly getting pretty messy. Rivers and aquifers don't care about borders, right? So when one country builds a dam or pollutes upstream, their neighbors get pissed. Look at India vs Pakistan with the Indus River, or that whole Egypt-Ethiopia thing over the Nile. These fights spill over into trade wars and military tensions. Plus they kill other diplomatic deals that might've worked out. It's wild how something as basic as water access is becoming this huge geopolitical weapon. Worth watching if you want to predict where the next international drama's gonna blow up.
So the coolest stuff happening right now? Membrane bioreactors are crushing it - they mix biological treatment with fancy filtration. AI monitoring is pretty wild too, adjusting everything in real-time. Companies are going smaller with decentralized systems now, treating water right on-site instead of hauling it across town. Smart sensors help dial in chemical doses perfectly. Honestly, the energy efficiency improvements some membrane companies are pulling off are insane. All this tech is making water reuse way cheaper and more reliable. I'd definitely check out what the membrane players are doing first if you're curious.
Water campaigns work because they make people actually see what's usually invisible - like, you don't think about your water usage until someone shows you the numbers. It's kinda like your phone battery thing. What really works is showing people their neighbors are already saving water (peer pressure is real), giving specific tips instead of just saying "conserve water," and using those smart meters for instant feedback. Oh, and combining education with super easy fixes helps too - finally dealing with that annoying dripping faucet you've been putting off for months.
You'll want to track water efficiency first - gallons per unit and where you're losing water to leaks. Cost per gallon treated is huge too. Environmental stuff matters obviously - discharge standards, protecting local sources. Quality metrics, customer satisfaction scores, service outages. Honestly, I'd just build a simple dashboard with maybe 5-7 key things instead of tracking everything under the sun. Pick the metrics that'll actually change how you make decisions, not the ones that just make pretty charts for meetings. That's where most people mess up.
Three things you gotta tackle: pricing, infrastructure, and regulations. Tiered pricing works best - cheap rates for basic needs, but jack up costs when people waste water. Infrastructure's the real pain though, super expensive but you can't skip upgrading pipes in poor areas. That's honestly where most places screw up. Water rights need reform too, plus mandatory conservation rules. Oh and community partnerships are clutch for figuring out priorities. Start by mapping where your biggest access gaps are first - sounds boring but you'll save yourself headaches later trying to fix the wrong problems.
Education totally changes how people see water - instead of just taking it for granted, they actually start protecting it. Kids are honestly the secret weapon here because they'll go home and nag their parents about wasting water (way more effective than you'd think). The trick is making it super relevant to what's happening locally, not just throwing random global stats at people. Focus on your community's specific water problems first. Like if you're dealing with drought, start there. Schools work great, but really any place where you can teach people about their watershed and conservation tricks. Once people understand the connection, behavior follows.
So IWRM gets all the water players - cities, farmers, industries, environmental folks - talking instead of constantly battling each other. Everyone sits at the same table with shared data and planning processes they all helped build. Way better than each group just doing their own thing, honestly. You end up with decisions based on the whole water system instead of random turf wars. It's like a giant family meeting but for entire watersheds (minus the weird uncle drama hopefully). First step is figuring out who your stakeholders actually are and what they need from the water resources.
Honestly, dams are kind of a mixed bag. They mess up fish migration pretty badly, and the water temperature changes can throw off entire ecosystems. Plus sediment gets trapped, which screws with downstream flow. The human cost is rough too - whole communities get forced to relocate, sometimes thousands of people. Their fishing spots and farmland? Gone. I mean, you do get flood protection and renewable energy out of it. But man, those environmental and social costs are hefty. If you're looking at a dam project, don't just focus on the electricity benefits - weigh all that other stuff too.
-
Design layout is very impressive.
-
Awesomely designed templates, Easy to understand.
-
Great quality product.
-
Editable templates with innovative design and color combination.
-
Awesome presentation, really professional and easy to edit.