

Water sector analysis powerpoint presentation slides




Try Before you Buy Download Free Sample Product
 Impress Your
 Audience
 100%
100% Editable
 Save Hours
 of Time


Water Sector Analysis Powerpoint Presentation Slides blends insightful data gathered by industry experts with winning designs curated by skilled developers. This impactful virtual tool satisfies the PPT presentation needs of individuals involved in the water industry. This presentation is a useful comprehensive analysis of the water market covering every related aspect. Communicate the water market size in terms of growth rate and capital expenditure using a neat tabular format. Our PowerPoint theme is replete with appealing data visuals to make information gripping and aesthetics sound. Elucidate the global water treatment market divided on the basis of industry and geography. The former is supported with a doughnut percentage chart, whereas the latter features a high-definition world map design. Also included in the water industry assessment PPT complete deck are infographic-style slides to represent US and global water industry key statistics. Our in-depth water market research PowerPoint slideshow also includes the latest growth drivers and trends. Download the water industry outlook to elaborate water pollution sources, natural processes, and human processes that affect water quality. Our Water Sector Analysis Powerpoint Presentation Slides are topically designed to provide an attractive backdrop to any subject. Use them to look like a presentation pro.
People who downloaded this PowerPoint presentation also viewed the following :
Content of this Powerpoint Presentation
Slide 1: This slide introduces Water Sector Analysis. State your Company name and begin.
Slide 2: This slide displays Content of the presentation.
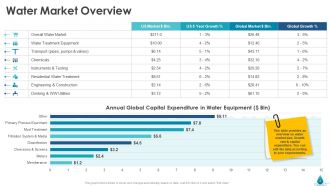
Slide 3: This slide showcases Water market overview.
Slide 4: This slide provides an overview on water market size, Growth rate & capital expenditure. You can edit the data according to your requirements.
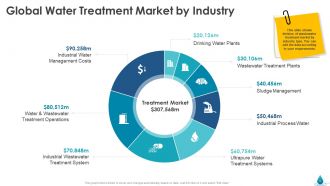
Slide 5: This slide shows division of wastewater treatment market by industry type. You can edit the data according to your requirements.
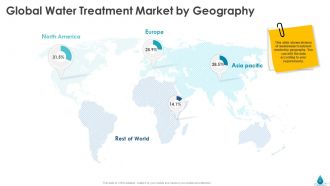
Slide 6: This slide shows division of wastewater treatment market by geography. You can edit the data according to your requirements.
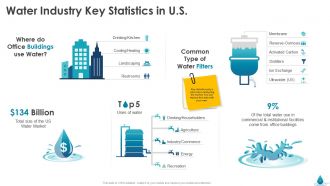
Slide 7: This slide depicts Water Industry Key Statistics in U.S.
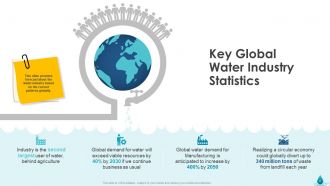
Slide 8: This slide provides forecast about the water industry based on the current patterns globally.
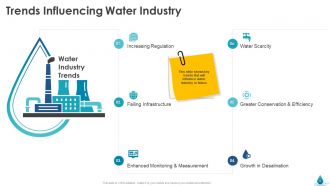
Slide 9: This slide shows key trends that will influence water industry in future.
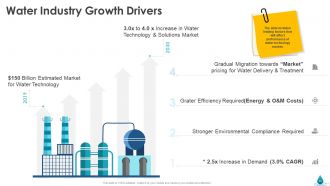
Slide 10: The slide includes leading factors that will affect performance of water technology market.
Slide 11: This slide provides Brief overview on optimization of deterioration in water quality
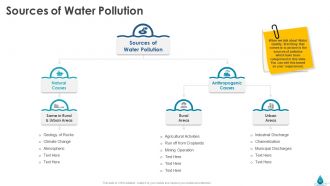
Slide 12: This slide shows Sources of Water Pollution.
Slide 13: This slide showcases Natural Processes Effecting Water Quality.
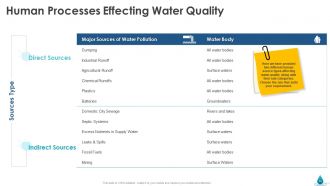
Slide 14: This slide shows Human Processes Effecting Water Quality.
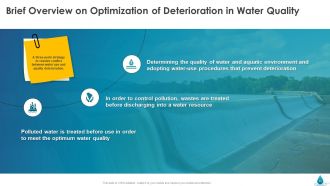
Slide 15: This slide presents Brief Overview on Optimization of Deterioration in Water Quality.
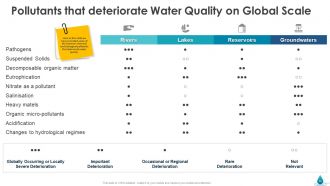
Slide 16: In this slide we have provided some of the common chemical and biological pollutants that deteriorate water quality.
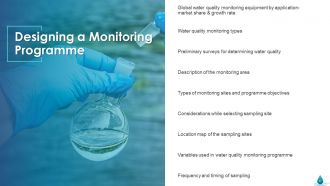
Slide 17: This slide provides information regarding Designing a Monitoring Programme
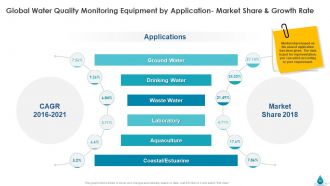
Slide 18: This slide depicts Global Water Quality Monitoring Equipment by Application- Market Share & Growth Rate
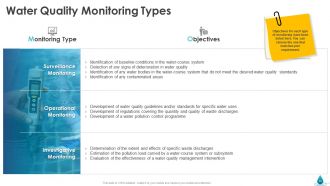
Slide 19: This slide showcases Water Quality Monitoring Types.
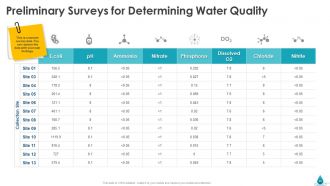
Slide 20: This slide depicts Preliminary Surveys for Determining Water Quality
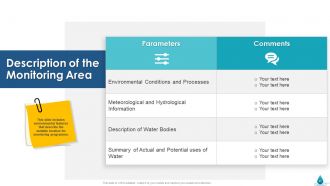
Slide 21: This slide includes environmental features that describe the suitable location for monitoring programme.
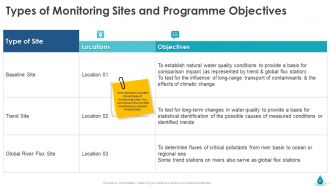
Slide 22: This slide showcases Types of Monitoring Sites and Programme Objectives.
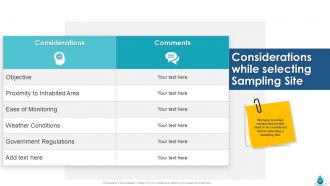
Slide 23: This slide depicts Considerations while selecting Sampling Site.
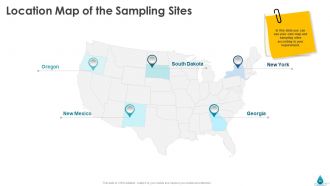
Slide 24: In this slide you can use your own map and sampling sites according to your requirement.
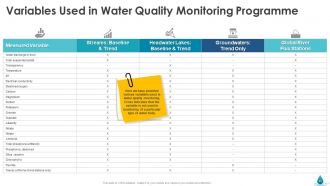
Slide 25: This slide showcases Variables Used in Water Quality Monitoring Programme
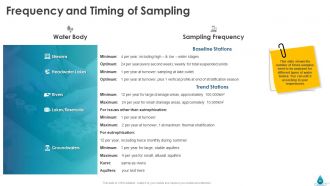
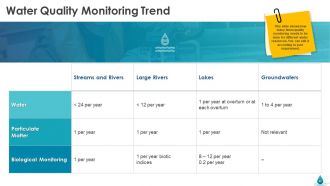
Slide 26: This slide shows the number of times samples need to be analysed for different types of water bodies. You can edit it according to your requirement.
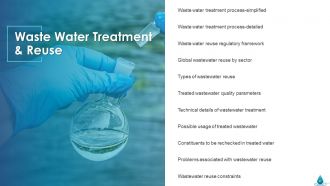
Slide 27: This slide showcases Waste Water Treatment & Reuse
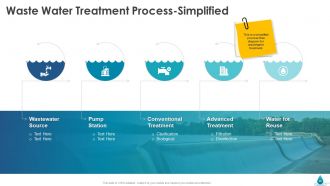
Slide 28: This slide presents Waste Water Treatment Process-Simplified.
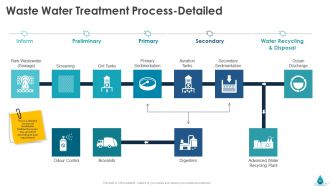
Slide 29: This slide depicts Waste Water Treatment Process-Detailed
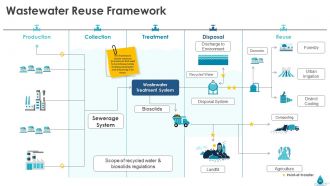
Slide 30: The framework shows common procedures that need to be followed while treating wastewater and disposing it for reuse.
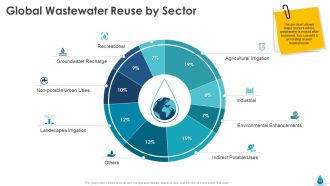
Slide 31: The pie chart in the slide shows major sectors where wastewater is reused after treatment. You can edit it according to your requirements.
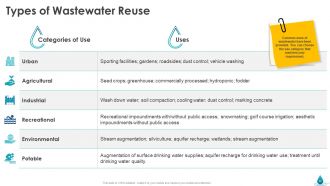
Slide 32: This slide shows Types of Wastewater Reuse
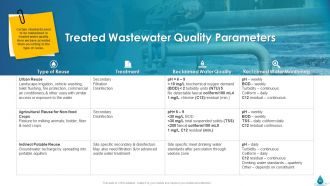
Slide 33: This slide displays Treated Wastewater Quality Parameters.
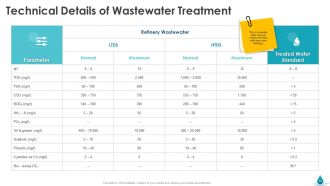
Slide 34: This slide showcases Technical Details of Wastewater Treatment.
Slide 35: This slide displays Possible Usage of Treated Wastewater
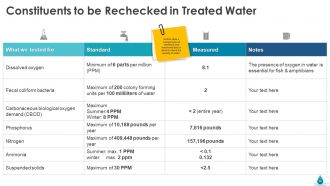
Slide 36: This slide shows comparison of standard and measured data is done to check the quality of water.
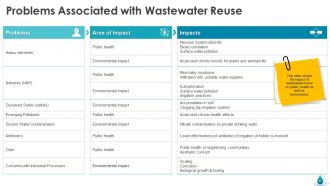
Slide 37: This slide presents Problems Associated with Wastewater Reuse
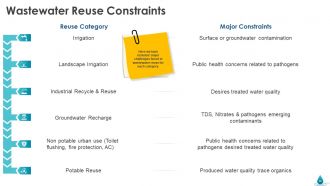
Slide 38: This slide showcases Wastewater Reuse Constraints
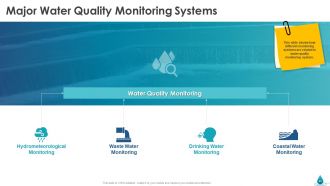
Slide 39: This slide showcases Major water quality monitoring systems.
Slide 40: This slide shows how different monitoring systems are related to water quality monitoring system.
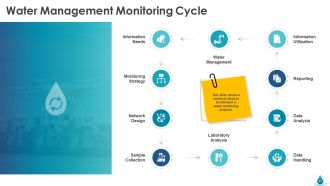
Slide 41: This slide shows a series of steps to be followed in water monitoring projects.
Slide 42: This slide shows how many times quality monitoring needs to be done for different water resources. You can edit it according to your requirement.
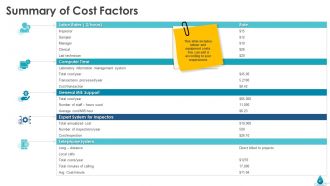
Slide 43: This slide displays Summary of cost factors
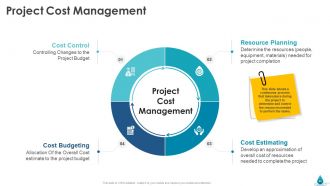
Slide 44: This slide shows a continuous process that takes place during the project to determine and control the resources needed to perform the tasks.
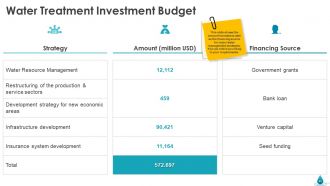
Slide 45: This slide shows the amount invested as well as the financing source for major water management strategies. You can edit it according to your requirements.
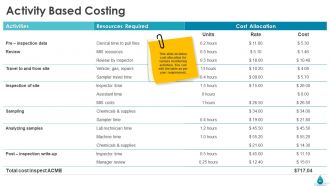
Slide 46: This slide includes cost allocation for various monitoring activities. You can edit the table as per your requirement.
Slide 47: This slide includes labour and equipment costs. You can edit it according to your requirement.
Slide 48: This slide showcases KPI Metrics & Dashboards
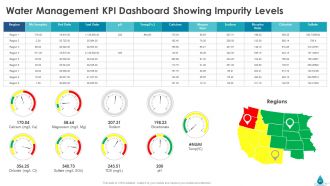
Slide 49: This slide displays Water Management KPI Dashboard Showing Impurity Levels
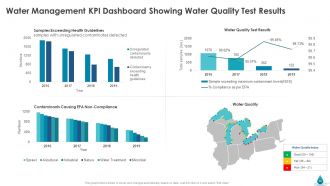
Slide 50: This slide showcases Water Management KPI Dashboard Showing Water Quality Test Results
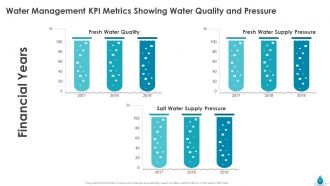
Slide 51: This slide depicts Water Management KPI Metrics Showing Water Quality and Pressure
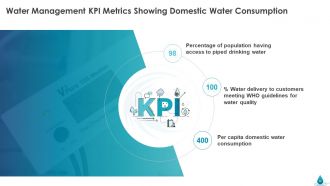
Slide 52: This slide showcases Water Management KPI Metrics Showing Domestic Water Consumption
Slide 53: This slide is titled as Additional Slides for moving forward.
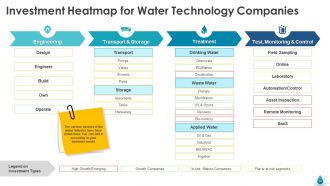
Slide 54: This slide shows Investment Heatmap for Water Technology Companies
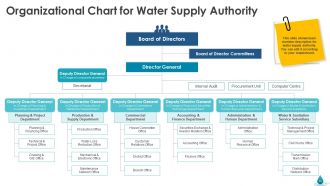
Slide 55: This slide shows Organizational Chart for Water Supply Authority
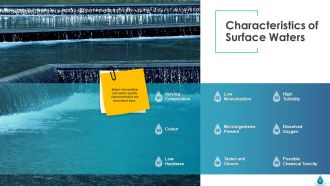
Slide 56: This slide displays Characteristics of Surface Waters
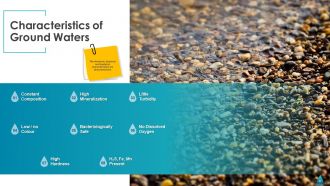
Slide 57: This slide showcases Characteristics of Ground Waters
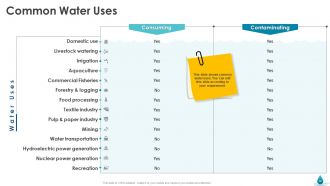
Slide 58: This slide shows common water uses. You can edit this slide according to your requirement.
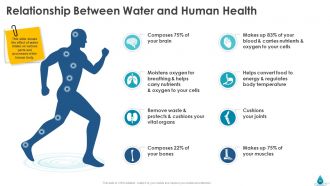
Slide 59: This slide shows the effect of water intake on various parts and processes of the human body.
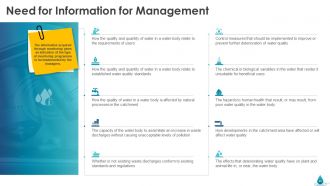
Slide 60: This slide displays Need for Information for Management
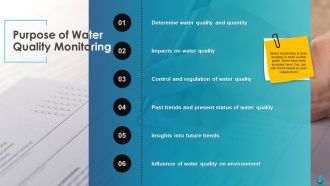
Slide 61: This slide shows Influence of water quality on environment.
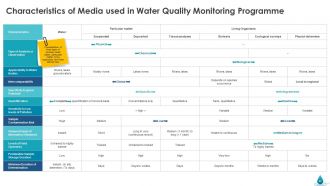
Slide 62: This slide depicts Characteristics of Media used in Water Quality Monitoring Programme
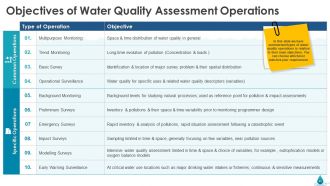
Slide 63: In this slide we have summarized types of water quality operations in relation to their main objectives. You can choose whichever matches your requirement.
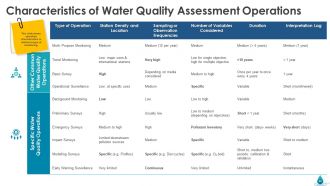
Slide 64: This slide shows operation characteristics in relation to type of monitoring.
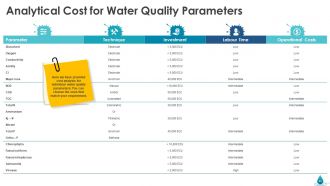
Slide 65: This slide shows Analytical Cost for Water Quality Parameters
Slide 66: This is Water Sector Analysis Icons Slide
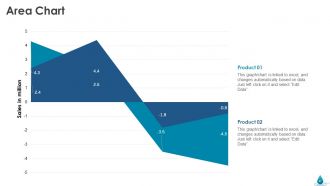
Slide 67: This slide displays Area Chart for comparison of two products.
Slide 68: This slide displays Column Chart for Comparison of products.
Slide 69: This slide is titled as Post It Notes. Post your important notes.
Slide 70: This is Idea Generation slide.
Slide 71: This slide displays Our Goal.
Slide 72: This slide shows Roadmap process.
Slide 73: This slide shows Our Goal.
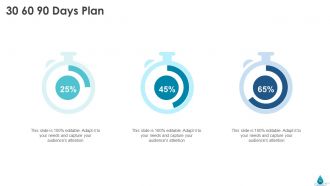
Slide 74: This is 30 60 90 Days Plan slide.
Slide 75: This is Thank You slide with Contact details.
Water sector analysis powerpoint presentation slides with all 75 slides:
Use our Water Sector Analysis Powerpoint Presentation Slides to effectively help you save your valuable time. They are readymade to fit into any presentation structure.





FAQs for Water sector analysis
Ugh, it's such a mess right now. Aging infrastructure is the big one - pipes that are literally falling apart. Water scarcity keeps getting worse with climate change making everything chaotic. Don't even get me started on regulations... they change constantly and nobody can keep up. Population's growing but funding isn't keeping pace. Then you've got cybersecurity issues on top of stricter quality standards. Honestly feels overwhelming sometimes. My advice? Start with understanding your local regs first since that'll dictate everything else you need to plan around. It's boring but necessary groundwork.
So basically climate change screws with water in every way possible. You get more droughts AND more floods - talk about the worst of both worlds. Droughts concentrate all the nasty stuff in whatever water's left, while floods bring contamination from runoff and totally overwhelm treatment plants. Higher temperatures mess with evaporation rates too, making your usual water sources way less reliable. Historical data? Pretty much useless now since everything's more extreme. The smart move is diversifying water sources and beefing up treatment capacity before things get worse. Which honestly feels like it's happening faster than anyone expected.
So water tech is getting crazy good right now. IoT sensors give you real-time quality data, AI predicts demand and optimizes distribution. Satellite imagery tracks groundwater and crop stress - pretty wild stuff. Smart meters are a game changer too (no more BS estimated bills). Advanced treatment like membrane bioreactors and smart desalination systems automatically adapt to conditions. Oh, and for your analysis? Focus on tech that shows clear ROI through cutting waste or boosting efficiency. The compliance tracking angle is solid money too. Honestly, the data control we have now versus even five years ago is night and day.
Honestly, innovative financing is a game-changer for water projects because it pulls in way more private investors who usually avoid this sector. Green bonds are huge right now with ESG folks. Blended finance mixes public and private money, which spreads the risk around. There's also revenue-backed securities that basically turn future water payments into immediate cash - pretty clever actually. The trick is structuring deals where private investors get solid returns but public entities still control water access and pricing. I'd start by figuring out what financing gaps your region has first. That'll tell you which approach makes the most sense.
Honestly, tiered pricing and smart meters are your best bet - they give you real-time data so you catch problems early. Leak detection systems save tons of money too. Water recycling programs work great, though they take longer to set up. Public education is surprisingly effective, like 10-15% reduction if people actually pay attention. I'd start with an audit to find the easiest fixes first. Oh, and don't underestimate the behavioral stuff - people waste way more water than they realize once you show them the numbers.
Honestly, public-private partnerships work pretty well for water stuff. Companies bring the money and tech know-how that cities usually don't have. They're motivated to actually perform since their profits depend on it. Meanwhile, the public side keeps things affordable and accessible - which is crucial obviously. You just gotta structure the deals right though. Clear performance targets, fair risk sharing, solid regulations. Manila and Chile have some decent examples if you want to look into it. The tricky part is balancing efficiency with making sure everyone can still afford clean water.
So basically, when there's not enough water, farms get absolutely wrecked. Crops need steady watering or you're seeing 20-40% less food grown in the worst hit areas. California's Central Valley is already dealing with this mess, same with parts of India. Farmers have to switch to crops that don't drink as much water, which totally changes what food is available locally. Rice and almonds? Yeah, those prices are gonna climb since they're water hogs. What I'd watch for is how places are adapting - farmers investing in drip irrigation systems and those new drought-resistant seeds. That's your early warning sign right there.
So urbanization is basically a double hit on water systems. More people packed together means way higher demand - obviously. But here's the thing that gets overlooked: all that concrete actually kills your water supply too. When you pave everything over, rainwater just runs off instead of soaking into groundwater. Plus you're usually building right on top of the best aquifer spots, which is honestly pretty dumb when you think about it. Most planning just looks at population growth but misses this supply crunch completely.
Look, you've got three main things to focus on: universal service requirements, subsidies for low-income families, and solid regulatory oversight of pricing. Most governments totally botch the subsidy part though - they make it way too complicated or just don't fund it enough. Your regulators need to set quality standards and actually penalize utilities when they screw over underserved areas. Otherwise utilities will just chase the profitable customers, which honestly makes sense from their perspective but sucks for everyone else. Start by figuring out who's getting left behind in your area first.
Look, countries sharing rivers basically have to sit down and hash out who gets what water and how clean it needs to be. The Mekong River Commission does this - not perfectly, but it works okay. You want binding agreements with actual teeth, plus everyone sharing data and talking regularly. Honestly, the smart move is getting the technical people together first. Scientists and engineers usually figure out the basics way faster than politicians do, then you can worry about the diplomatic stuff later. Joint monitoring systems help too since nobody trusts each other's numbers.
So the main ones you'll want to check are pH, dissolved oxygen, turbidity, and bacterial stuff like E. coli. Fish literally can't live without enough dissolved oxygen - it's like their version of air quality. pH shows if things are too acidic or basic, turbidity is basically how cloudy the water looks (huge deal for drinking water), and bacterial counts tell you about contamination. Oh, and heavy metals like lead or mercury depending on where you're testing. Really though, it depends what you're dealing with - drinking water versus like, environmental monitoring. I'd start with those four and go from there based on what your local regs say.
Honestly, you'll get way better decisions when people actually have a say in their water systems. Residents know stuff you don't - like which pipes always burst or when demand spikes seasonally. They're also more likely to take care of things they helped plan. The trick is making their input actually matter, not just holding pointless meetings. I'd start by figuring out who your key players are and how they prefer to communicate. Some neighborhoods love town halls, others ignore them completely. Just don't make it feel like you're going through the motions - people can smell that from a mile away.
Hey! So pollution basically wrecks freshwater systems in a bunch of ways. Chemical runoff triggers eutrophication - that's when algae blooms go crazy and suck up all the oxygen, suffocating fish. Plastics and toxins build up through the food chain too. Heavy metals mess with reproduction rates and can totally shift which species survive. Oh, and pesticides are awful for this stuff. For your water analysis, I'd track pollution sources upstream first. That'll show you how problems cascade downstream - gives you the best read on what's actually happening to ecosystem health. Makes sense?
Water regulation is all over the place depending where you look. The UK has Ofwat running the whole show, but here in the US it's complete chaos - federal, state, and local agencies all doing their own thing. Europe's pretty strict with their EU water quality rules. Singapore has everything locked down tight (honestly impressive), while other Asian countries are still figuring out the basics. Developing regions? Total mixed bag. You really need to check what kind of regulatory setup you're dealing with first. It'll completely change how you read the pricing data and investment trends. Trust me on this one.
Honestly, membrane filtration is where it's at right now - reverse osmosis and nanofiltration are getting crazy efficient. UV-LED disinfection is blowing up too since it uses way less power than old-school UV systems. Smart sensors for real-time monitoring are finally becoming mainstream (which is wild because we should've had this tech years ago). Oh, and advanced oxidation processes are making contaminated water treatment actually work properly. If you're thinking investments, I'd look at companies doing hybrid membrane systems. They're basically combining everything for better performance and - this is key - lower costs.
-
Really like the color and design of the presentation.
-
Unique and attractive product design.
-
Excellent products for quick understanding.