


Organisation Chart IT Products And Services Company Profile Ppt Sample




Try Before you Buy Download Free Sample Product
 Impress Your
 Audience
 100%
100% Editable
 Save Hours
 of Time


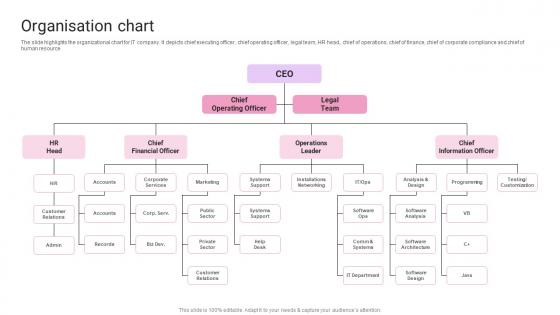
The slide highlights the organizational chart for IT company. It depicts chief executing officer, chief operating officer, legal team, HR head, chief of operations, chief of finance, chief of corporate compliance and chief of human resource.
People who downloaded this PowerPoint presentation also viewed the following :
Organisation Chart IT Products And Services Company Profile Ppt Sample with all 6 slides:
Use our Organisation Chart IT Products And Services Company Profile Ppt Sample to effectively help you save your valuable time. They are readymade to fit into any presentation structure.





FAQs for Organisation Chart IT Products And Services Company
Key components of an effective organization chart include clear hierarchical structure, defined reporting relationships, departmental divisions, role titles with responsibilities, and communication pathways. These elements streamline decision-making processes, enhance operational efficiency, and minimize confusion across teams, with many organizations finding that well-designed charts ultimately deliver improved accountability and faster strategic implementation.
An organization chart improves communication by clearly defining reporting relationships, establishing communication pathways, and identifying key decision-makers across departments and hierarchical levels. With visual clarity of roles and responsibilities, employees can efficiently direct inquiries, collaborate across teams, and streamline information flow, ultimately reducing miscommunication and enhancing operational efficiency throughout the organization.
**INPUT**: What tools or software are best for creating organization charts? **OUTPUT**: Top organization chart tools include Microsoft Visio, Lucidchart, OrgCharter, SmartDraw, and Creately, with many organizations also leveraging PowerPoint and specialized HR platforms. These solutions streamline chart creation through drag-and-drop interfaces, automated data integration, and real-time collaboration features, ultimately delivering enhanced organizational transparency and more efficient workforce planning across departments. [Word count: 56 words]
**INPUT**: How do you design an organization chart that reflects your company culture? **OUTPUT**: Designing an organization chart that reflects company culture involves incorporating cultural values through structural hierarchy, communication flows, reporting relationships, and visual elements that emphasize collaboration or autonomy. Companies increasingly use flexible frameworks, cross-functional team representations, and inclusive leadership models, with many organizations finding that transparent structures enhance employee engagement, streamline decision-making, and ultimately strengthen cultural alignment across departments. [Word count: 60 words]
Organization charts evolve significantly as businesses grow, transitioning from simple flat structures to complex hierarchical frameworks with specialized departments, clear reporting lines, and defined roles. Growing companies typically add middle management layers, create specialized functions like HR and finance, and establish regional divisions, ultimately delivering improved operational efficiency and enabling better resource allocation across expanding teams.
Hierarchical organization charts feature multiple management levels with clear vertical reporting structures, while flat charts minimize layers between executives and front-line employees, emphasizing horizontal communication and broader spans of control. These structural approaches deliver different outcomes, with hierarchical models providing clear authority chains and specialized roles, while flat structures enable faster decision-making and enhanced collaboration, ultimately helping organizations balance control with agility.
Organization charts benefit remote teams by providing clear reporting structures, defining communication pathways, establishing accountability frameworks, and creating visual team hierarchies that enhance coordination across distributed locations. Through digital org charts, remote organizations streamline decision-making processes, minimize role confusion, and facilitate seamless collaboration, with many distributed teams finding that structured visibility ultimately delivers improved operational efficiency and stronger team connectivity.
Organization charts serve as strategic blueprints for succession planning by mapping current leadership structures, identifying critical positions, and visualizing potential career progression pathways within the organization. These visual frameworks enable companies to systematically assess talent gaps, develop targeted leadership development programs, and ensure business continuity, with many organizations finding that structured succession planning reduces transition risks and strengthens long-term operational stability.
Organization charts should be updated quarterly or after major structural changes, role modifications, new hires, departures, and departmental reorganizations to maintain accuracy and operational effectiveness. Regular updates ensure employees understand reporting structures, facilitate better communication across teams, and support strategic planning initiatives, with many organizations finding that current charts significantly enhance workflow efficiency and reduce confusion during periods of growth or restructuring.
Common mistakes include outdated information, unclear reporting relationships, overly complex hierarchies, missing key roles, and inconsistent formatting across departments. These errors can create confusion about accountability, hinder communication flow, and undermine decision-making processes, with many organizations finding that regular updates and clear visual design ultimately enhance operational efficiency and employee understanding.
Color and design elements enhance organization charts by improving visual hierarchy, enabling quick role identification, and increasing information retention through strategic use of contrast and grouping. These visual enhancements streamline navigation across complex organizational structures, with many companies finding that well-designed charts facilitate better communication, reduce confusion during restructuring, and ultimately deliver improved organizational transparency.
**INPUT**: What are the implications of not having a clear organization chart? **OUTPUT**: Not having a clear organization chart creates confusion around reporting structures, accountability gaps, communication breakdowns, duplicated responsibilities, and inefficient decision-making processes. These structural ambiguities ultimately hinder operational efficiency and employee productivity, with many organizations finding that unclear hierarchies lead to delayed project timelines, conflicting priorities, and reduced competitive advantage in increasingly complex business environments.
Organization charts aid onboarding by providing visual clarity of reporting structures, departmental functions, team hierarchies, key contacts, and communication pathways that new hires need to navigate effectively. Through interactive organizational mapping, companies streamline orientation processes, reduce confusion about roles and responsibilities, and accelerate integration, with many finding that structured visual guidance significantly improves employee confidence and productivity during critical first weeks.
A matrix organization chart proves most beneficial when managing complex projects requiring cross-functional collaboration, such as product development in technology companies, research initiatives in pharmaceuticals, or global campaigns in marketing agencies. This structure enables organizations to leverage specialized expertise across departments while maintaining project focus, ultimately delivering faster innovation cycles, improved resource utilization, and enhanced knowledge sharing throughout the enterprise.
Employee feedback improves organization chart accuracy by identifying outdated reporting relationships, unclarifying role definitions, missing informal leadership structures, and cross-departmental collaboration patterns that formal records often miss. Through regular surveys and input sessions, organizations can capture real workflow dynamics, update hierarchies to reflect actual decision-making processes, and ensure charts represent current operational realities rather than theoretical structures.
-
It saves your time and decrease your efforts in half.
-
Excellent products for quick understanding.