


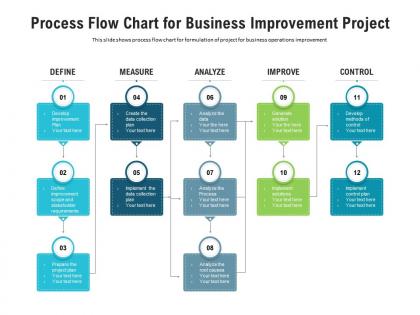
Process flow chart for business improvement project




Try Before you Buy Download Free Sample Product
 Impress Your
 Audience
 100%
100% Editable
 Save Hours
 of Time


This slide shows process flow chart for formulation of project for business operations improvement
People who downloaded this PowerPoint presentation also viewed the following :
Process flow chart for business improvement project with all 2 slides:
Use our Process Flow Chart For Business Improvement Project to effectively help you save your valuable time. They are readymade to fit into any presentation structure.
FAQs for Process flow chart for
Key metrics include cycle time reduction, cost savings, error rates, customer satisfaction scores, employee productivity measures, and compliance adherence rates. These indicators enable organizations to track operational efficiency, quality improvements, and resource optimization across departments, with many companies finding that combining quantitative data with qualitative feedback ultimately delivers comprehensive insights into their strategic transformation efforts.
Lean and Six Sigma integration combines Lean's waste elimination and flow optimization with Six Sigma's data-driven defect reduction and statistical analysis. This strategic combination enables organizations to streamline operations while maintaining quality control, with many manufacturing and service companies finding that the dual approach delivers faster cycle times, reduced costs, and enhanced customer satisfaction simultaneously.
Employee feedback serves as a critical diagnostic tool for identifying process inefficiencies, bottlenecks, workflow gaps, and customer pain points that management might overlook. Frontline workers in manufacturing, healthcare, and retail organizations often provide the most valuable insights about operational challenges, enabling companies to streamline procedures, reduce waste, and enhance service delivery while fostering a culture of continuous improvement.
Technology advancements like automation and AI significantly accelerate business process improvement by eliminating manual tasks, reducing errors, and enabling data-driven decision making. Through machine learning algorithms and robotic process automation, organizations streamline operations, enhance accuracy, and free up employees for strategic work, ultimately delivering faster services, lower operational costs, and improved competitive positioning.
Organizations commonly face resistance to change from employees, lack of leadership support, insufficient resources and training, poor communication about benefits, and difficulty measuring success effectively. While these challenges can initially slow implementation, many companies find that addressing cultural concerns early, securing executive buy-in, and demonstrating quick wins through pilot programs ultimately streamlines adoption and delivers sustainable operational improvements.
Process mapping enhances understanding by creating visual representations of workflows, identifying bottlenecks, redundancies, and inefficiencies that teams can collectively analyze and address. These visual tools streamline communication across departments by providing a shared reference point, enabling stakeholders to discuss specific process steps, propose targeted improvements, and track implementation progress, ultimately delivering clearer project outcomes and faster consensus-building.
Ensuring stakeholder buy-in requires clear communication of benefits, involving key stakeholders in planning phases, demonstrating quick wins through pilot programs, and providing comprehensive training support. Organizations across manufacturing, healthcare, and financial services find that transparent progress reporting, addressing resistance concerns proactively, and showcasing measurable ROI ultimately delivers sustained engagement and successful implementation outcomes.
Measuring ROI of business process improvements involves calculating cost savings, productivity gains, quality enhancements, and reduced cycle times against implementation costs. Organizations track metrics like processing time reduction, error rate decreases, and resource optimization, with many companies finding that streamlined processes deliver 15-30% efficiency improvements and significantly enhanced customer satisfaction within the first year.
Sustaining long-term improvements requires continuous monitoring, regular process audits, employee training programs, performance metrics tracking, and embedding changes into organizational culture. Organizations across manufacturing, healthcare, and financial services find that combining automated monitoring systems with ongoing staff development and leadership commitment ultimately delivers lasting operational efficiency and competitive advantage.
Organizational culture significantly influences process improvement effectiveness by shaping employee receptivity to change, leadership commitment to initiatives, and willingness to challenge existing workflows. Companies with collaborative, innovation-focused cultures see higher adoption rates and sustained improvements, while organizations fostering transparency and continuous learning enable teams to identify inefficiencies faster, ultimately delivering enhanced operational performance and competitive advantage.
Best practices for conducting a successful process audit include defining clear objectives, mapping current workflows, gathering stakeholder input, analyzing performance metrics, and documenting findings systematically. These approaches streamline audits by ensuring comprehensive coverage, identifying bottlenecks accurately, and enabling data-driven recommendations, with many organizations finding that structured methodologies ultimately deliver faster improvements and measurable operational efficiency gains.
Customer feedback drives business process improvements by identifying pain points, revealing operational inefficiencies, highlighting service gaps, and uncovering automation opportunities that enhance customer experiences. Through systematic feedback analysis, organizations streamline workflows, reduce response times, and optimize resource allocation, with many companies finding that customer-driven improvements ultimately deliver higher satisfaction rates, increased loyalty, and significant competitive advantages.
Businesses effectively leverage data analytics in process improvement by identifying bottlenecks, measuring performance metrics, predicting operational challenges, and optimizing resource allocation across workflows. Through advanced analytics platforms, organizations streamline manufacturing operations, enhance customer service delivery, and accelerate decision-making processes, with many finding that data-driven insights ultimately deliver significant cost reductions and competitive advantages.
Training and development are critical for process improvement success because they equip employees with necessary skills, ensure consistent implementation of new procedures, and drive cultural change toward continuous improvement. Through comprehensive training programs, organizations minimize resistance to change, accelerate adoption of optimized workflows, and ultimately deliver enhanced operational efficiency and sustained competitive advantage.
Regulatory requirements significantly shape business process improvement in highly regulated industries by mandating compliance frameworks, audit trails, and standardized documentation protocols. While these constraints can slow implementation, they also drive systematic improvements in healthcare, banking, and pharmaceuticals, ultimately delivering enhanced transparency, risk mitigation, and operational consistency that creates competitive advantages.
-
Excellent products for quick understanding.
-
Presentation Design is very nice, good work with the content as well.
-
Unique research projects to present in meeting.
-
Unique research projects to present in meeting.